
Articles
- Page Path
- HOME > J Powder Mater > Volume 33(2); 2026 > Article
-
Research Article
- Influence of Ta Addition on Austenite Stability and Strain-Induced Martensite Transformation in Sintered Fe-7Mn Alloy
- Seunghyeok Choi, Sungjin Kim, Junho Lee, Seok-Jae Lee*
-
Journal of Powder Materials 2026;33(2):119-129.
DOI: https://doi.org/10.4150/jpm.2026.00066
Published online: April 30, 2026
Department of Advanced Materials Engineering, Jeonbuk National University, Jeonju 54896, Republic of Korea
- *Corresponding Author: Seok-Jae Lee E-mail: seokjaelee@jbnu.ac.kr
© The Korean Powder Metallurgy & Materials Institute
This is an Open Access article distributed under the terms of the Creative Commons Attribution Non-Commercial License (http://creativecommons.org/licenses/by-nc/4.0/) which permits unrestricted non-commercial use, distribution, and reproduction in any medium, provided the original work is properly cited.
- 801 Views
- 6 Download
Abstract
- This study examines the effect of Ta addition on austenite stability and strain-induced martensitic transformation behavior in Fe–7Mn alloys fabricated by powder metallurgy. Fe–7Mn–xTa alloys (x = 0, 1, and 1.5 wt.%) were produced via mechanical alloying followed by spark plasma sintering, achieving nearly full relative density for all compositions. With increasing Ta content, the initial retained austenite fraction significantly increased, reaching 80.55 vol.% in the Fe–7Mn–1.5Ta alloy. EBSD analysis revealed a grain coarsening tendency with Ta addition, indicating that the increase in retained austenite fraction could not be explained solely by grain refinement. Compression tests up to 20% strain showed strain-induced martensitic transformation in all alloys, with substantially more pronounced transformation observed in the Fe–7Mn–1.5Ta alloy. The Burke–Matsumura–Tsuchida model showed that the austenite stability parameter (k), where higher values indicate lower stability, increased from 3.89 to 10.62 with Ta addition. Ta thus exhibits a dual effect: promoting retained austenite after sintering while reducing its deformation stability. The hardening efficiency per unit martensite fraction decreased with Ta content, and a preliminary correlation between k and hardening efficiency suggests that austenite stability governs the mechanical response of Fe–Mn-based alloys.
- Third-generation advanced high-strength steels have attracted considerable attention as structural materials, particularly for automotive sheet steel applications, due to their ability to achieve high strength and excellent ductility with reduced alloying content [1, 2]. A key concept underlying these materials is the use of metastable retained austenite, as employed in transformation-induced plasticity (TRIP), twinning-induced plasticity (TWIP), and quenching and partitioning (Q&P) steels. In these alloys, strain-induced martensitic transformation during deformation effectively mitigates the conventional strength–ductility trade-off by enhancing work hardening behavior [3-6].
- In Fe-based alloys, austenite is thermodynamically stable only at high temperatures and tends to transform into ferrite during cooling. In pure Fe, the stability fields of austenite and ferrite are separated at approximately 912 °C, and austenite cannot exist as a stable phase below the Ae1 temperature [7, 8]. Despite this limitation, it is well established that retaining a certain fraction of metastable austenite at room temperature enables effective control of mechanical properties through the TRIP effect. Consequently, both the volume fraction and the stability of retained austenite have become critical design parameters in Fe-based alloys [9, 10].
- The stability of retained austenite at room temperature is primarily influenced by chemical composition and grain size. Austenite-stabilizing elements such as Mn, Ni, and C expand the austenite stability region and lower the martensite start (MS) temperature. Carbon is known to be the most effective stabilizer, while manganese plays a particularly important role in TRIP, TWIP, and Q&P steels [11-15].
- In addition, Ta addition has been reported in some steels to promote grain refinement through the precipitation of TaC particles, which can inhibit prior austenite grain growth and result in a finer austenite grain size compared with Ta-free steels. Such grain refinement has been suggested to enhance austenite stability by suppressing martensitic transformation [16-18].
- In addition to chemical composition, grain refinement is widely recognized as an effective approach to enhance austenite stability by suppressing martensitic transformation. This enhanced stability is closely related to the change in martensitic variant formation behavior. In large austenite grains, multiple martensitic variants can form simultaneously, leading to partial accommodation of transformation strain. In contrast, ultrafine grains restrict the formation of variants, resulting in increased transformation strain and enhanced resistance to martensitic transformation. Consequently, a critical grain size exists below which austenite stability is significantly improved. Considering that the lath width of martensite in low-carbon steels is typically in the range of 100–500 nm, grain refinement is expected to play a crucial role in stabilizing ultrafine austenite grains (<500 nm). This is further supported by experimental observations in medium-Mn steels, where the optimal austenite grain size for stability has been reported to be approximately 500–600 nm. A similar trend has also been reported by Lee et al., who demonstrated that in a 6 wt.% Mn TRIP steel, retained austenite was stabilized at room temperature only when the average austenite grain size was below approximately 500 nm. Therefore, grain refinement below a critical ultrafine grain size may contribute significantly to suppressing martensitic transformation and enhancing austenite stability [15, 19-22].
- However, conventional processing routes, including casting followed by forging or rolling and subsequent heat treatment, impose intrinsic limitations on achieving stable ultrafine grain sizes. As a result, the retained austenite fraction in such alloys often remains limited to a few percent, restricting the contribution of the TRIP effect to mechanical property enhancement [23, 24]. To address this issue, powder metallurgy–based processing routes have gained increasing interest. Mechanical alloying (MA) enables the production of nanocrystalline alloy powders through high-energy ball milling, while simultaneously improving alloying efficiency by reducing atomic diffusion distances [25, 26]. Subsequent consolidation by spark plasma sintering (SPS) allows rapid densification under pulsed electric current and uniaxial pressure, effectively suppressing grain growth and producing high-density compacts within a short processing time [27]. The MA–SPS route therefore provides a promising approach for achieving a high fraction of retained austenite even at relatively low alloying levels, and enhanced austenite stability and mechanical properties have been reported in Fe–Mn-based sintered alloys processed using this method [28-35].
- Previous studies on Fe–Mn-based sintered alloys have mainly examined the effects of Mn content, milling time, process control agents, SPS parameters, and the addition of alloying elements such as Ni, C, Co, and Mo on austenite stability and mechanical behavior [28-35]. In contrast, the influence of Ta addition on austenite stability and deformation behavior in Fe–Mn-based sintered alloys has received relatively little attention. Tantalum exhibits a large atomic-size mismatch with Fe and a low equilibrium solubility, and under non-equilibrium powder metallurgy conditions, it may influence grain evolution, precipitation strengthening, and modifications in austenite stability. From the perspective of TRIP-based alloy design, Ta can therefore be regarded as a potentially influential alloying element in Fe–Mn systems.
- Accordingly, this study systematically investigates the effect of Ta addition on microstructure, initial austenite fraction, strain-induced martensitic transformation behavior under compressive deformation, and mechanical properties of Fe–7Mn alloys fabricated by mechanical alloying followed by spark plasma sintering. Particular attention is given to the quantitative relationship between strain-induced martensite formation and hardness evolution using the austenite stability parameter (k), in order to clarify the role of austenite stability in governing deformation-induced hardening behavior.
1. Introduction
- 2.1. Powder preparation and fabrication of sintered specimens
- Nanocrystalline Fe–7 wt.% Mn–x wt.% Ta (x = 0, 1, and 1.5) alloy powders were produced by high-energy ball milling. The starting materials consisted of Fe powder (99.9% purity, average particle size < 75 μm, Höganäs), Mn powder (99.6% purity, average particle size < 10 μm, Alfa Aesar), and Ta powder (99.97% purity, average particle size < 44 μm, Alfa Aesar). Stearic acid (CH3(CH2)16CO2H, Alfa Aesar) was added as a process control agent (PCA) at a concentration of 1 wt.% to regulate the balance between cold welding and fracturing during the milling process. Mechanical alloying was conducted using a high-energy planetary ball mill (FRITSCH, Pulverisette-6) under an Ar atmosphere at a rotational speed of 250 rpm for 24 h. The ball-to-powder ratio (BPR) was fixed at 30:1, and 10 mm diameter Fe–Cr–C balls together with an SKD-11 steel vial were employed. The milled powders were subsequently loaded into a cylindrical graphite die with an outer diameter of 35 mm, an inner diameter of 10 mm, and a height of 40 mm. Two graphite punches with a diameter of 10 mm and a height of 20 mm were used to assemble the die set. To prevent powder adhesion during sintering, both the graphite die and punches were coated with a BN lubricant. Sintering was carried out using spark plasma sintering (SPS). The samples were heated to 1000 °C at a heating rate of 1000 °C/min under a uniaxial pressure of 80 MPa in a high-vacuum environment below 150 mTorr. After reaching the target temperature, the specimens were immediately cooled to room temperature inside the vacuum chamber without any holding time.
- 2.2. Microstructural characterization and mechanical property evaluation
- The relative density of the sintered specimens was measured using the Archimedes method. Phase identification of both the milled powders and the sintered specimens before and after compression was performed using X-ray diffraction (XRD, Shimadzu XRD-6100). A Cu Kα radiation source was employed, and the measurements were conducted at an operating voltage of 40 kV and a current of 30 mA. XRD patterns were collected over a 2θ range of 30–100° with a scanning rate of 2°/min. Prior to XRD measurements, the specimens were mechanically polished to a final surface finish of 0.25 μm. The crystallite size of the milled powders was estimated using the Williamson–Hall method. The volume fraction of austenite in the sintered specimens was quantitatively determined from the integrated intensities of the XRD diffraction peaks. The microstructure of the samples was characterized using a field-emission scanning electron microscope (FE-SEM, Carl Zeiss, Gemini 500). Prior to FE-SEM measurements, the specimens were mechanically polished up to 0.25 μm and subsequently etched using a 2% nital solution for microstructural observation. Electron backscatter diffraction (EBSD) analysis was performed using a field-emission scanning electron microscope (FE-SEM, Schottky type, Hitachi SU-70) to evaluate the grain size. The specimens were mechanically polished up to 0.25 μm, followed by final polishing using colloidal silica. EBSD measurements were conducted at an accelerating voltage of 15 kV with a step size of 0.014 μm at a magnification of 10,000. Phase indexing was performed using FCC austenite and BCC phase (ferrite/martensite), while HCP martensite was excluded due to poor indexing reliability. Grain size was evaluated using a 15° misorientation criterion considering only grains larger than 0.2 μm. Standard cleanup procedures including grain CI standardization, neighbor orientation correlation, and grain dilation were applied prior to analysis. For compression testing, the sintered specimens were machined into cylindrical samples with a diameter and height of 4 mm. Room-temperature compression tests were carried out using a universal testing machine (Instron 5569) at a strain rate of 1 × 10⁻³ s-1. To investigate microstructural evolution during deformation, the compression tests were interrupted at 10% and 20% strain. The hardness of the specimens before and after compression was measured using a Rockwell hardness tester (SSAUL BESTECH, BESTROC-300N). Compression testing was selected as the deformation mode in this study because the limited specimen dimensions obtainable from SPS-processed materials precluded the preparation of standard tensile specimens, while compression testing remains an effective method for characterizing strain-induced martensitic transformation and deformation-induced hardening behavior.
2. Experimental
- Fig. 1 presents the X-ray diffraction (XRD) patterns of mechanically alloyed Fe–7 wt.% Mn–x wt.% Ta powders (x = 0, 1, and 1.5). Regardless of Ta content, only diffraction peaks corresponding to the bcc Fe phase were detected, while no peaks associated with Mn or Ta were observed. This indicates that the added alloying elements were effectively incorporated into the Fe matrix during mechanical alloying without the formation of detectable secondary phases within the resolution of XRD. Such behavior is consistent with previous reports showing that mechanical alloying enables a high apparent solid solubility of alloying elements owing to its non-equilibrium nature [36].
- The crystallite size of the mechanically alloyed powders was evaluated using the Williamson–Hall method, as expressed in Eq. (1) [37]:
- The crystallite size was determined from the intercept of the linear fit obtained by plotting βᵣcosθ as a function of sinθ. Based on this analysis, the average crystallite sizes were estimated to be approximately 5.44 nm for Fe–7Mn–0Ta, 4.55 nm for Fe–7Mn–1Ta, and 4.27 nm for Fe–7Mn–1.5Ta. The formation of such nanocrystalline powders can be attributed to the severe plastic deformation imposed during high-energy ball milling. In mechanical alloying, the minimum attainable crystallite size is governed by both the intrinsic properties of the constituent elements and the milling conditions, and generally decreases with increasing melting temperature [26]. Given the substantially higher melting temperature of Ta (3017 °C) compared to Fe (1538 °C) and Mn (1246 °C), the observed reduction in crystallite size with increasing Ta content suggests that Ta addition promotes enhanced grain refinement during milling.
- The mechanically alloyed powders were subsequently consolidated by spark plasma sintering (SPS). As summarized in Table 1, all sintered specimens achieved relative densities exceeding 99% of their theoretical values, indicating effective densification under the SPS conditions employed. Notably, the high density was obtained irrespective of Ta content, suggesting that Ta addition did not hinder the sintering behavior of the Fe–7Mn alloys.
- Fig. 2 shows the XRD patterns of the sintered Fe–7Mn alloys with different Ta contents. In all cases, diffraction peaks corresponding to both α-Fe (bcc) and γ-Fe (fcc) phases were detected, indicating the coexistence of ferrite and retained austenite at room temperature. The retained austenite is considered to have formed at elevated temperatures during SPS and partially preserved upon cooling. The austenite volume fraction was quantified using Eq. (2) [38]:
- The austenite volume fractions of the Fe–7Mn–0Ta, Fe–7Mn–1Ta, and Fe–7Mn–1.5Ta alloys were determined to be 45.54, 56.52, and 80.55 vol.%, respectively. The reliability of XRD-based quantitative phase analysis in Fe-based alloys has been well established, showing good agreement with EBSD measurements [30-33]. The pronounced increase in retained austenite fraction with increasing Ta content suggests that Ta addition promotes austenite retention after sintering. This effect may be associated with changes in phase stability, alloying effect of Ta and Mn, and various microstructural factors related to the refined crystallite structure produced during mechanical alloying.
- Fig. 3 shows SEM micrographs, EDS elemental maps, and EDS line-scan compositional profiles of the sintered Fe–7Mn alloys with different Ta contents. While a relatively uniform matrix structure was observed in the Fe–7Mn alloy (Fig. 3(a)), fine precipitates with bright contrast were observed in the Ta-added Fe–7Mn–1Ta and Fe–7Mn–1.5Ta alloys (Fig. 3(b,c)), and the number density of these precipitates tended to increase with increasing Ta content. This suggests that Ta addition induced the formation of secondary phases during sintering. EDS elemental mapping results (Fig. 3(d,e)) showed that Ta was locally enriched at the bright precipitates, while C and O were also detected. In particular, Mn enrichment was observed in O-enriched regions, suggesting the possible formation of Mn–O-based oxides (e.g., MnO). In contrast, Ta was preferentially enriched in the bright precipitate regions, supporting the formation of Ta-containing precipitates. These observations suggest that carbide and oxide precipitates may have formed simultaneously in the Ta-added alloys. Point EDS analysis (Table 2) further showed that the particle region (P1) exhibited significantly higher Ta and C contents than the matrix region (M1), with Ta increasing from 0.58 at.% to 10.06 at.% and C increasing from 17.14 at.% to 34.06 at.%. These results suggest that Ta preferentially interacted with C, leading to the formation of Ta-rich carbide precipitates, likely TaC. This may be associated with the strong carbide-forming tendency of Ta. Although carbon was not intentionally added in this study, carbon introduced through decomposition or residual stearic acid used as a process control agent during mechanical alloying, as well as carbon diffused from the graphite mold and foil during SPS, may have reacted with Ta and contributed to TaC formation. EDS line-scan results (Fig. 3(f–h)) also revealed Fe depletion accompanied by Ta enrichment at the precipitate locations, together with co-enrichment of C and O.
- These observations are consistent with the elemental mapping and point EDS results, supporting the possible coexistence of Ta–C-based carbides and Mn–O-based oxides. These precipitates may have acted as microstructural factors that influence carbon distribution and phase stability within the matrix.
- Fig. 4 shows the EBSD inverse pole figure (IPF) maps and equivalent circle diameter (ECD) distributions of Fe–7Mn–xTa (x = 0, 1, and 1.5) alloys. Compared with Fe–7Mn (Fig. 4(a)), a general grain coarsening tendency was observed in the Ta-added Fe–7Mn–1Ta and Fe–7Mn–1.5Ta alloys (Fig. 4(b,c)). This trend was also confirmed by the overall grain ECD distributions (Fig. 4(d–f)) and the austenite grain ECD distributions (Fig. 4(g–i)). The area-average grain size was 0.96, 1.08, and 1.31 μm for Fe–7Mn, Fe–7Mn–1Ta, and Fe–7Mn–1.5Ta, respectively. The average austenite grain size was 0.83, 1.29, and 1.51 μm. These results suggest that Ta addition led to an overall grain coarsening tendency rather than grain refinement-induced growth suppression. Interestingly, despite this grain coarsening, the as-sintered retained austenite fraction increased with increasing Ta content. This suggests that the retained austenite fraction is governed not only by grain size, but also by multiple factors, including changes in phase stability, alloying effects, and the precipitate formation discussed earlier. Therefore, the increase in retained austenite fraction with Ta addition is considered to arise from the combined effects of phase stability changes and microstructural factors rather than from grain refinement-induced stabilization.
- Figs. 2 and 5 show the XRD patterns before and after 20% compressive deformation, respectively, while Fig. 6 summarizes the evolution of austenite fraction with increasing strain. Prior to deformation, the austenite fractions of the Fe–7Mn–0Ta, Fe–7Mn–1Ta, and Fe–7Mn–1.5Ta alloys were 45.54, 56.52, and 80.55 vol.%, respectively. After 20% compressive deformation, the austenite fractions decreased to 43.98, 53.78, and 68.78 vol.%, corresponding to estimated strain-induced martensite fractions of 1.56, 2.77, and 11.77 vol.%, respectively. For the Fe–7Mn–0Ta and Fe–7Mn–1Ta alloys, the relatively small changes in austenite fraction after 20% strain were close to the uncertainty range associated with XRD-based quantitative phase analysis. Therefore, additional interrupted compression tests at 10% strain were conducted under identical conditions to further verify the transformation behavior. After 10% compressive deformation, the austenite fractions were measured to be 44.78, 54.66, and 74.85 vol.% for the Fe–7Mn–0Ta, Fe–7Mn–1Ta, and Fe–7Mn–1.5Ta alloys, respectively, with all values lying between those measured before deformation and after 20% strain. As shown in Fig. 6, the austenite fraction in all alloys gradually decreased with increasing strain, with the largest reduction observed in the Fe–7Mn–1.5Ta alloy. This supports the interpretation that the decrease in austenite fraction observed after 20% strain reflects a consistent strain-dependent change rather than random measurement scatter. These results suggest that strain-induced martensitic transformation occurred in all alloys, although the extent of transformation was limited in Fe–7Mn–0Ta and Fe–7Mn–1Ta, whereas substantially more pronounced transformation was observed in Fe–7Mn–1.5Ta. This indicates that Ta addition influences martensitic transformation behavior during deformation, particularly at 1.5 wt.% Ta. To further assess measurement reproducibility, duplicate XRD measurements were performed on a representative specimen, yielding a deviation of approximately 0.14 vol.%, which supports that the observed strain-dependent changes in austenite fraction reflect meaningful transformation behavior rather than random measurement scatter.
- Several models have been proposed to describe the transformation kinetics of strain-induced martensite as a function of strain [39-42]. To quantitatively describe the transformation kinetics, the Burke–Matsumura–Tsuchida (BMT) model was applied [41-43]:
- where Vα′ is the strain-induced martensite fraction,
-
Equation (3) can be rearranged into the linearized form shown in Equation (4), which can be expressed as y=ax where y represents the Linearized BMT function calculated from the left-hand side of Equation (4), x is the compressive strain (ε), and the slope a corresponds to
- Fig. 9 shows the relationship between retained austenite fraction and Rockwell hardness of Fe–7Mn–xTa (x = 0, 1, and 1.5) alloys before and after 20% compressive deformation. Prior to deformation, the hardness values of the Fe–7Mn, Fe–7Mn–1Ta, and Fe–7Mn–1.5Ta alloys were 55.00 ± 0.27, 47.14 ± 1.01, and 43.28 ± 0.07 HRC, respectively, decreasing with increasing Ta content. This trend is associated with the increase in retained austenite fraction in the as-sintered state with Ta addition. Since austenite has relatively lower hardness than ferrite/martensite, the higher retained austenite fraction likely contributed to the lower initial hardness. After 20% compressive deformation, the hardness increased to 59.18 ± 0.32, 54.34 ± 1.14, and 50.94 ± 0.33 HRC for the Fe–7Mn, Fe–7Mn–1Ta, and Fe–7Mn–1.5Ta alloys, respectively. The corresponding total hardness increases were 4.18, 7.20, and 7.66 HRC, indicating greater overall hardening in the Ta-containing alloys. This increase can be attributed to the combined effects of strain-induced martensitic transformation and deformation-induced work hardening. Meanwhile, the calculated ΔHardness/ΔMartensite values were 2.679, 2.628, and 0.651 HRC/vol.% for the Fe–7Mn, Fe–7Mn–1Ta, and Fe–7Mn–1.5Ta alloys, respectively. Importantly, this decrease should not be interpreted as a reduction in total hardening, but rather as a decrease in hardening efficiency per unit volume fraction of transformed martensite. In other words, although the Fe–7Mn–1.5Ta alloy exhibited the largest hardness increase due to the formation of the greatest amount of strain-induced martensite, the hardness increase per unit martensite fraction was comparatively lower. This reduction in ΔHardness/ΔMartensite may be associated with several factors. First, the Ta–C rich precipitates observed in the SEM–EDS analysis may influence carbon distribution in the matrix, potentially affecting the effective carbon content available for martensite formation and, consequently, its hardening contribution [45]. Second, EBSD analysis showed a tendency for austenite grain coarsening with Ta addition; therefore, grain-refinement-induced Hall–Petch strengthening is unlikely to explain the observed hardening behavior. Rather, grain coarsening may have contributed to both lower matrix hardness and reduced austenite stability during deformation. Third, ΔHardness/ΔMartensite should be regarded not as the intrinsic hardness of martensite alone, but as an apparent hardening efficiency influenced collectively by retained austenite fraction, matrix hardness, work hardening, and the amount of strain-induced martensite formed. Therefore, the increase in total hardness and the decrease in ΔHardness/ΔMartensite with increasing Ta content are not contradictory. In the Fe–7Mn–1.5Ta alloy, large martensite formation led to substantial overall hardening, whereas the hardening contribution per unit martensite fraction was reduced, likely due to the combined effects of carbon redistribution, high initial retained austenite fraction, and austenite grain coarsening.
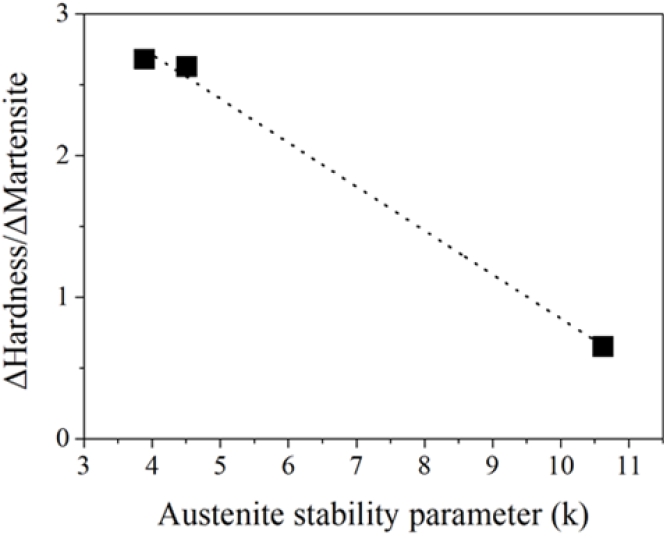
- Fig. 10 illustrates the relationship between the austenite stability parameter (k) and ΔHardness/ΔMartensite. Linear fitting yielded the relationship y=-0.31038x+3.9538 (R2=0.9926). Within the present dataset, a decreasing trend in ΔHardness/ΔMartensite was observed with increasing k, suggesting a possible correlation between austenite stability during deformation and hardening efficiency per unit martensite formation. Specifically, while reduced austenite stability (higher k) promotes strain-induced martensitic transformation, the present results suggest that excessively unstable austenite may reduce hardening efficiency per unit martensite fraction. This is qualitatively consistent with the previously discussed effects of carbon redistribution, high retained austenite fraction, and grain coarsening. However, since this correlation was derived based on only three compositional data points, there are limitations in extending it to a general linear relationship. Therefore, the linear fitting in Fig. 10 should be understood as a preliminary correlation indicating the trend observed under the conditions of this study, rather than as presenting a universal relationship.
- Based on the results of this study, further microstructural analyses (e.g., high-resolution TEM and atom probe tomography (APT)), as well as validation over a wider range of compositions and deformation conditions, would be valuable for more directly elucidating the mechanisms of microstructural evolution and strain-induced martensitic transformation during deformation.
3. Results and Discussion
(2)
- In this study, the effects of Ta addition on microstructure evolution, austenite stability, strain-induced martensitic transformation behavior, and deformation-induced hardening were systematically investigated in Fe–7Mn alloys fabricated by mechanical alloying followed by spark plasma sintering. The mechanically alloyed powders exhibited a single bcc Fe phase for all compositions. The average crystallite size of the milled powders decreased with increasing Ta content (~4.27 nm in Fe–7Mn–1.5Ta), whereas EBSD analysis of the sintered specimens revealed an opposite tendency of austenite grain coarsening with Ta addition, indicating that significant grain growth occurred during SPS consolidation. After sintering, all alloys achieved relative densities close to their theoretical values.
- After sintering, the retained austenite volume fraction increased significantly from 45.54 to 80.55 vol.% with increasing Ta content. SEM–EDS analysis suggested the formation of Ta-containing carbide precipitates and Mn–O based oxides in the Ta-added alloys, while EBSD analysis showed a tendency for austenite grain coarsening with increasing Ta content. These results suggest that the increase in retained austenite fraction in the as-sintered state was governed by complex interactions among alloying effects, precipitate formation, and microstructural factors, rather than by grain refinement alone.
- During compressive deformation, strain-induced martensitic transformation was observed in all alloys, although the extent of transformation was limited in the Fe–7Mn and Fe–7Mn–1Ta alloys and became substantially more pronounced in the Fe–7Mn–1.5Ta alloy. The austenite stability parameter (k), determined using the BMT transformation kinetics model, increased from 3.89 to 10.62 with increasing Ta content, indicating reduced austenite stability during deformation, particularly at 1.5 wt.% Ta. This trend was consistent with the observed austenite grain coarsening and suggests that retained austenite fraction and deformation stability are not necessarily governed by the same factors.
- The initial hardness decreased with increasing retained austenite fraction, whereas compressive deformation led to hardness increases in all alloys due to the combined effects of strain-induced martensitic transformation and work hardening. Although the overall hardness increment increased in the Ta-containing alloys, the hardness increment per unit martensite fraction (ΔHardness/ΔMartensite) decreased, indicating reduced hardening efficiency per unit transformed martensite. This behavior may be associated with the combined influence of carbon redistribution related to Ta–C precipitation, high retained austenite fraction, and grain coarsening.
- The present results suggest that austenite stability influences not only martensitic transformation behavior but also hardening efficiency. These findings highlight the importance of controlling austenite stability and associated microstructural factors to optimize the balance between martensitic transformation and deformation-induced hardening in TRIP-based Fe–Mn alloys.
4. Conclusion
-
Funding
This work was supported by Korea Institute for Advancement of Technology (KIAT) grant funded by the Korea Government(MOTIE) (RS-2024-00410332, HRD Program for Industrial Innovation).
-
Conflict of Interest
The authors have no conflicts of interest to declare.
-
Data Availability Statement
Data will be made available on request.
-
Author Information and Contribution
Seunghyeok Choi: Integrated M.S.-Ph.D candidate; Investigation, Methodology, Writing-original draft.
Sungjin Kim: Integrated M.S.-Ph.D candidate; Data curation, Formal analysis.
Junho Lee: Ph.D. candidate; Data curation, Formal analysis.
Seok-Jae Lee: Professor; Project supervision and funding acquisition, Overall study conceptualization, Critical review and editing of the manuscript.
-
Acknowledgments
None.
Article information


| density | Fe-7Mn-0Ta | Fe-7Mn-1.0Ta | Fe-7Mn-1.5Ta |
|---|---|---|---|
| theoretical (g/cm3) | 7.83 | 7.92 | 7.96 |
| measured (g/cm3) | 7.872±0.011 | 7.957±0.023 | 8.006±0.034 |
| relative (%) | 100 | 100 | 100 |
| Point | Location | Fe | Mn | Ta | C | O |
|---|---|---|---|---|---|---|
| P1 | Particle | 49.39 | 4.11 | 10.06 | 34.06 | 2.39 |
| M1 | Matrix | 75.46 | 5.83 | 0.58 | 17.14 | 1.00 |
- 1. T. Nanda, V. Singh, V. Singh, A. Chakraborty and S. Sharma: Proc. Inst. Mech. Eng. Pt. L J. Mater. Des. Appl., 233 (2009) 185.
- 2. D. K. Matlock and J. G. Speer, Microstructure and Texture in Steels: and Other Materials, Springer London, London (2009) 185.
- 3. H. Aydin, E. Essadiqi, I. H. Jung and S. Yue: Mater. Sci. Eng. A, 564 (2013) 501.Article
- 4. J. Noder, J. E. Gutierrez, A. Zhumagulov, J. Dykeman, H. Ezzat and C. Butcher: Materials, 14 (2021) 4970.Article
- 5. M. Soleimani, A. Kalhor and H. Mirzadeh: Mater. Sci. Eng. A, 795 (2020) 140023.Article
- 6. E. De Moor, J. G. Speer, D. K. Matlock and D. N. Hanlon, Mater. Sci. Technol., Columbus, Ohio (2011) 568.
- 7. R. Hultgren and C. A. Zapffe: Nature, 142 (1938) 395.ArticlePDF
- 8. F. Equihua and A. Salinas: Powder Diffr., 25 (2010) 31.Article
- 9. Y. F. Shen, L. N. Qiu, X. Sun, L. Zuo, P. K. Liaw and D. Raabe: Mater. Sci. Eng. A, 636 (2015) 551.Article
- 10. B. Xiao, Y. Yu, B. Hu, H. Wang, W. Wang, S. Liu and W. Liu: J. Mater. Res. Technol., 33 (2024) 7698.Article
- 11. C. Capdevila, F. G. Caballero and C. García de Andrés: Mater. Sci. Technol., 19 (2003) 581.Article
- 12. A. Bhattacharya, S. Biswal, R. K. Barik, B. Mahato, M. Ghosh, R. Mitra and D. Chakrabarti: Mater. Charact., 208 (2024) 113658.Article
- 13. Y. Zhao, Y. Cao, W. Wen, Z. Lu, J. Zhang, Y. Liu and P. Chen: Sci. Rep., 13 (2023) 5769.Article
- 14. K. Kim and S. J. Lee: Mater. Sci. Eng. A, 698 (2017) 183.Article
- 15. J. Park, J. Jeon, N. Seo, G. Kim, S. B. Son, J. G. Jung and S. J. Lee: Arch. Metall. Mater., 68 (2023) 77.Article
- 16. T. Hasegawa, Y. Tomita and A. Kohyama: J. Nucl. Mater., 258 (1998) 1153.Article
- 17. R. L. Klueh, D. J. Alexander and M. A. Sokolov: J. Nucl. Mater., 304 (2002) 139.Article
- 18. V. Shankar, K. Mariappan, A. Nagesha, G. P. Reddy, R. Sandhya, M. D. Mathew and T. Jayakumar: Fusion Eng. Des., 87 (2012) 318.Article
- 19. B. He: Materials, 13 (2020) 3440.Article
- 20. A. Wong: Mater. Sci. Technol., 38 (2022) 676.ArticlePDF
- 21. M. Shirdel, H. Mirzadeh and M. H. Parsa: Mater. Charact., 103 (2015) 150.Article
- 22. S. Lee, S. J. Lee and B. C. De Cooman: Scr. Mater., 65 (2011) 225.Article
- 23. T. Kvackaj, J. Bidulská and R. Bidulský: Materials, 14 (2021) 1988.Article
- 24. A. Abbasian, A. Ravangard, I. Hajian Nia and S. Mirzamohammadi: Int. J. Eng. Trans. C: Aspects, 35 (2022) 567.Article
- 25. M. S. El-Eskandarany, A. Al-Hazza, L. A. Al-Hajji, N. Ali, A. A. Al-Duweesh, M. Banyan and F. Al-Ajmi: Nanomater., 11 (2021) 2484.Article
- 26. C. Suryanarayana: Research, 2019 (2019) 17.Article
- 27. Y. Le Godec and S. Le Floch: Materials, 16 (2023) 997.Article
- 28. S. J. Oh, D. Park, K. Kim, I. J. Shon and S. J. Lee: Mater. Sci. Eng. A, 725 (2018) 382.Article
- 29. S. Choi, J. Jeon, N. Seo, Y. H. Moon, I. J. Shon and S. J. Lee: Arch. Metall. Mater., 65 (2020) 1001.Article
- 30. K. Kim, S. J. Oh, D. Park, I. J. Shon and S. J. Lee: Mater. Trans., 59 (2018) 1206.Article
- 31. J. Jeon, S. Choi, N. Seo, Y. H. Moon, I. J. Shon and S. J. Lee: Arch. Metall. Mater., 65 (2020) 1249.Article
- 32. S. J. Oh, I. J. Shon and S. J. Lee: J. Powder Mater., 25 (2018) 126.Article
- 33. S. Kim, S. B. Son and S. J. Lee: Mater. Trans., 66 (2025) 811.Article
- 34. W. Shin, S. B. Son, J. G. Jung and S. J. Lee: J. Powder Mater., 29 (2022) 517.Article
- 35. J. Park, J. Jeon, N. Seo, G. Kim, S. B. Son and S. J. Lee: J. Powder Mater., 28 (2021) 336.Article
- 36. C. Kuhrt and L. Schultz: J. Appl. Phys., 73 (1993) 6588.ArticlePDF
- 37. G. K. Williamson and W. H. Hall: Acta Metall., 1 (1953) 22–31.Article
- 38. E. ASTM, ASTM E975-00, Standard Practice for X-Ray Determination of Retained Austenite in Steel with Near Random Crystallographic Orientation, ASTM International, West Conshohocken, USA (2003).
- 39. D. C. Ludwigson and J. A. Berger: J. Iron Steel Inst., 207 (1969) 63.
- 40. K. I. Sugimoto, M. Kobayashi and S. I. Hashimoto: Metall. Mater. Trans. A, 23 (1992) 3085.ArticlePDF
- 41. O. Matsumura, Y. Sakuma and H. Takechi: Scr. Metall., 21 (1987) 1301.Article
- 42. N. Tsuchida and Y. Tomota: Mater. Sci. Eng. A, 285 (2000) 346.Article
- 43. J. Burke, Kinetics of Phase Transformation in Metals, Pergamon press, Oxford, New York (1965) 1.
- 44. C. Celada-Casero, J. Sietsma and M. J. Santofimia: Mater. Des., 167 (2019) 107625.Article
- 45. Y. Wang, Q. He, Q. Yang, D. Xu, Z. Yang and F. Zhang: Metals, 12 (2022) 822.Article
References
Figure & Data
References
Citations
 ePub Link
 Cite this Article
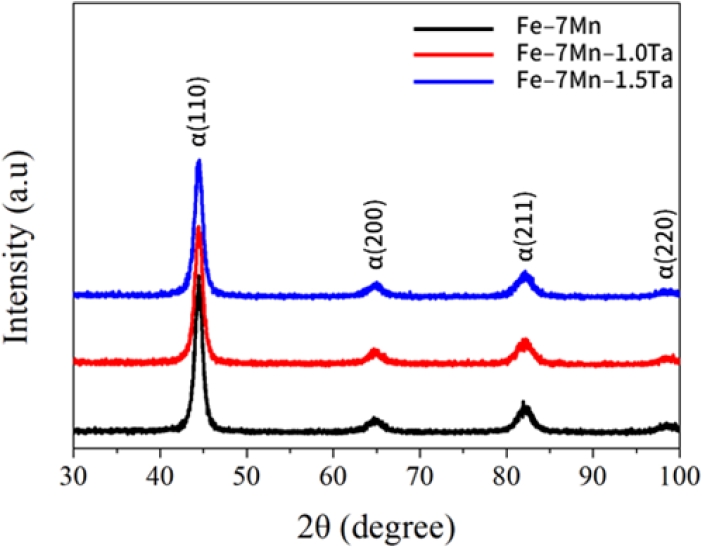
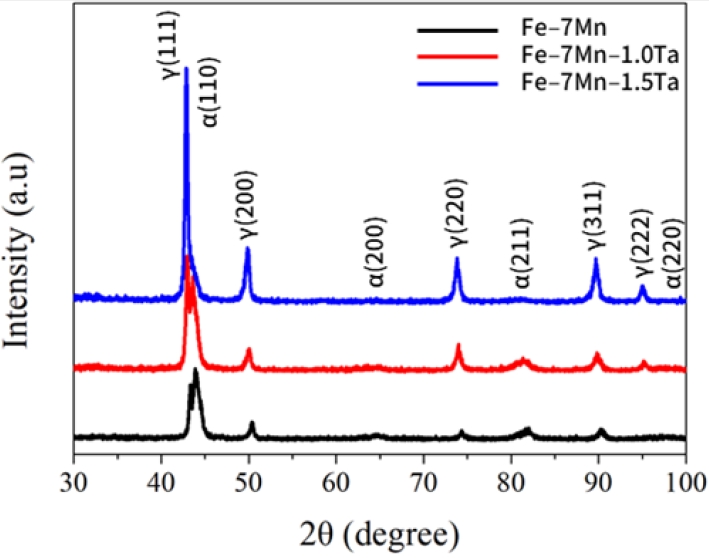
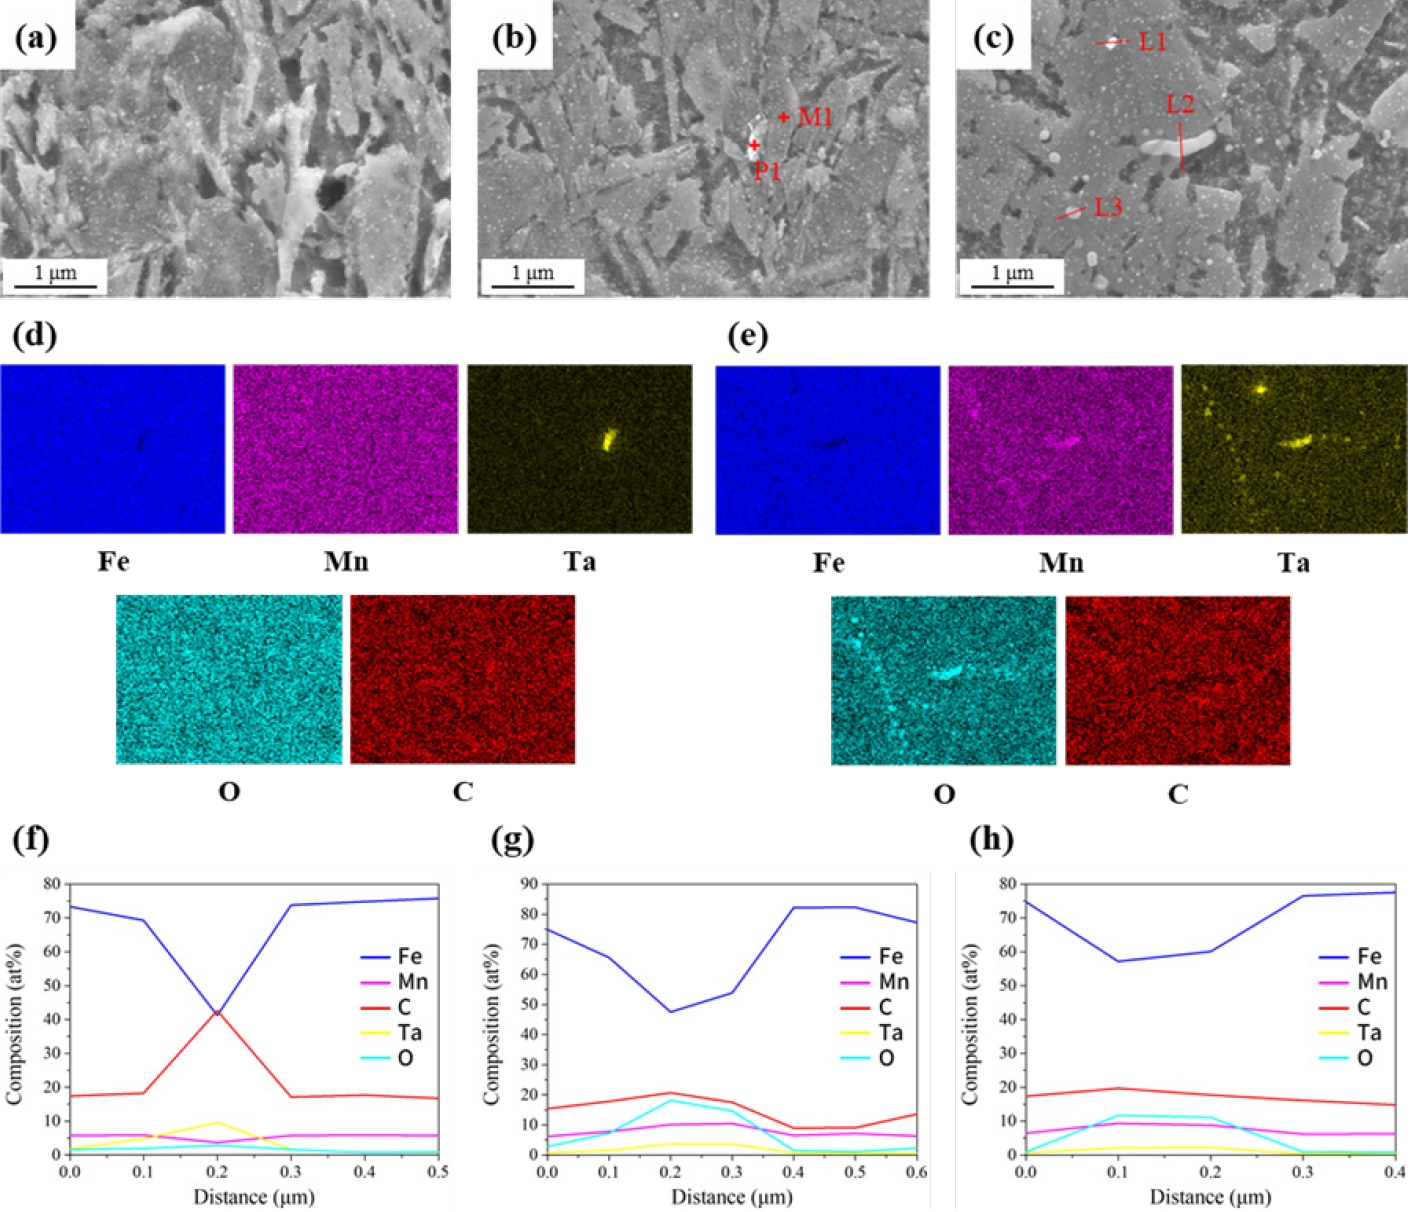
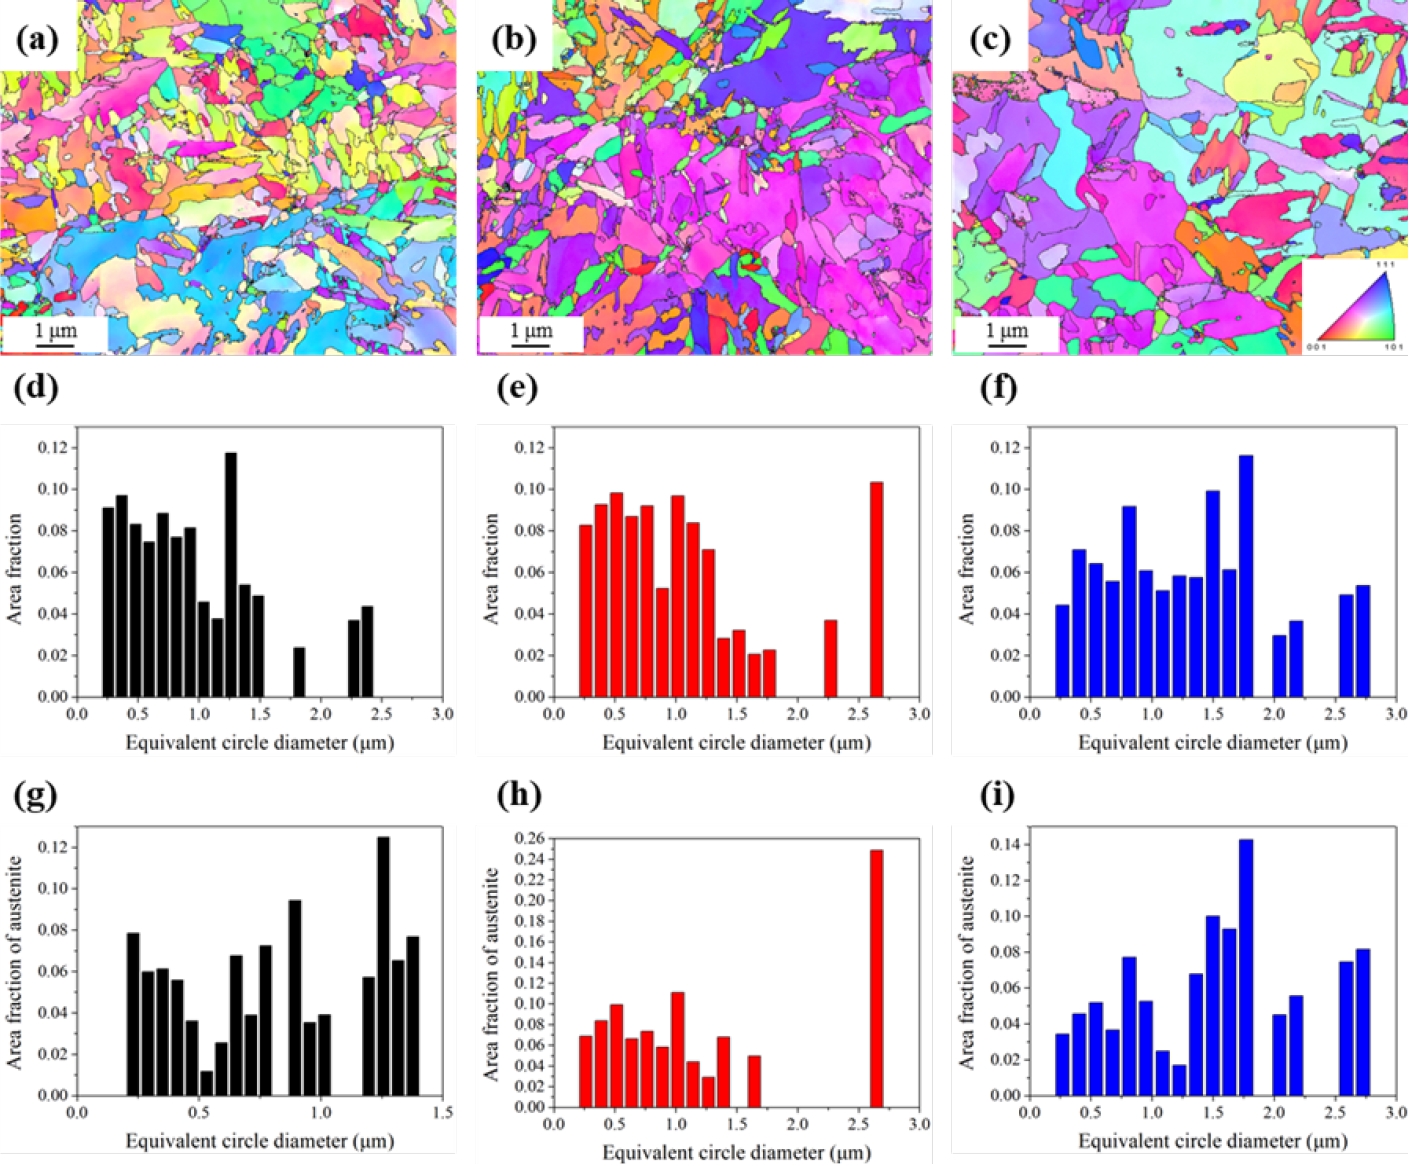
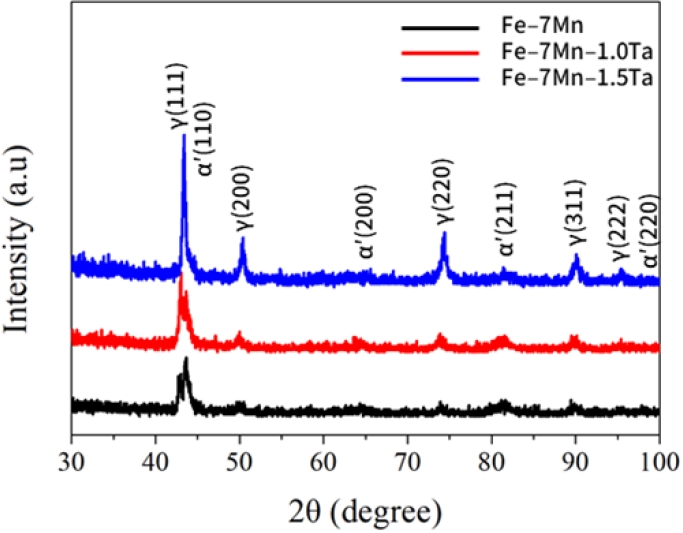
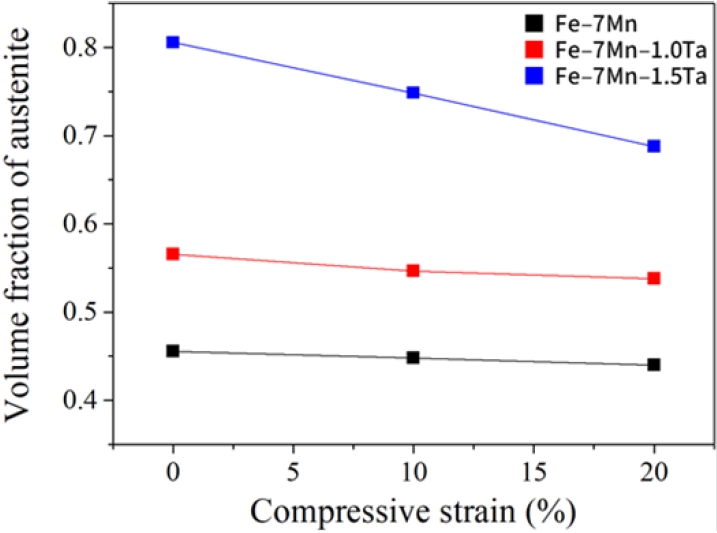
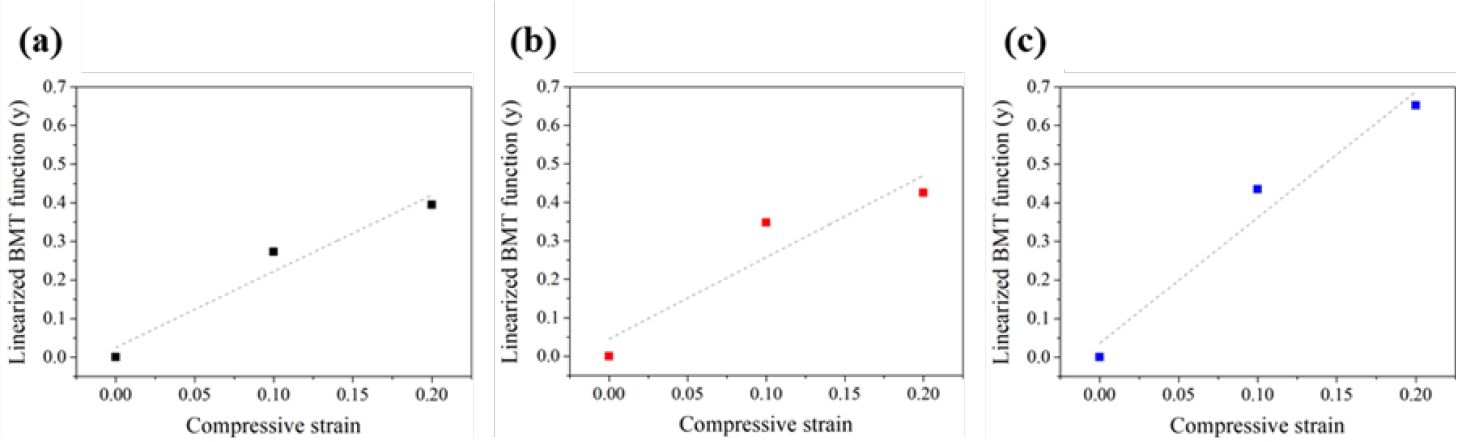

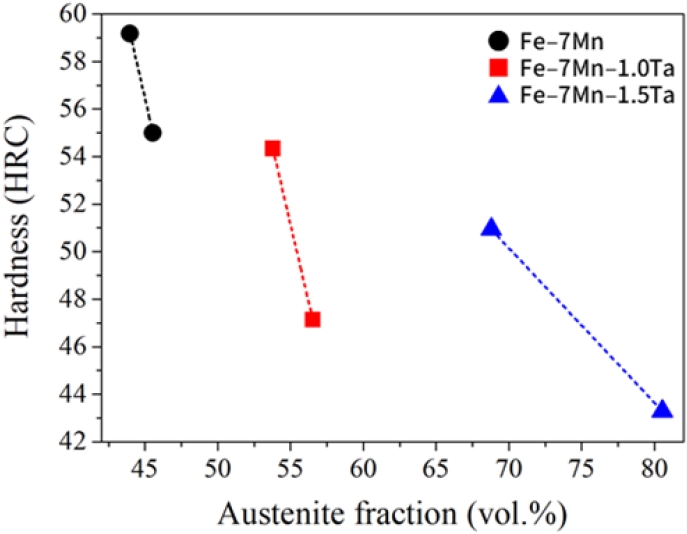


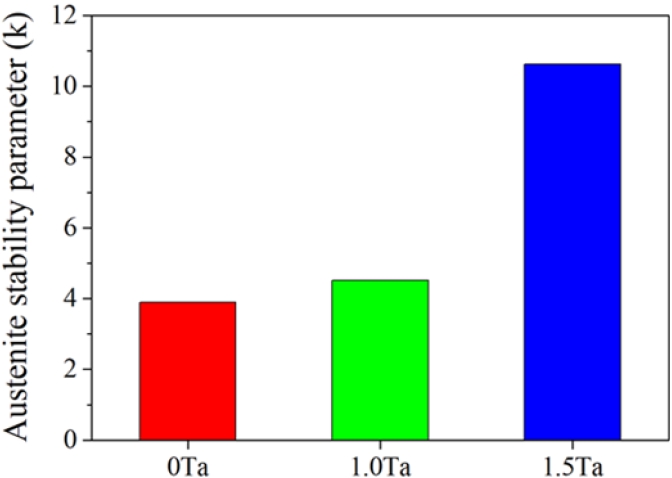


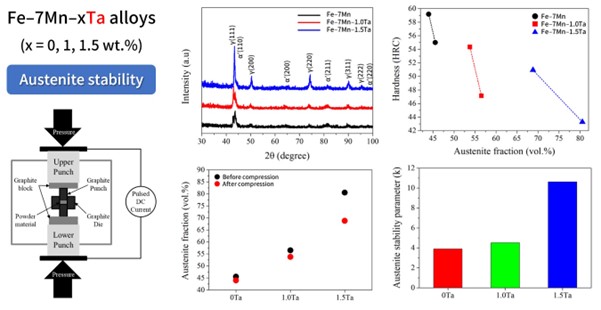
Fig. 1.
Fig. 2.
Fig. 3.
Fig. 4.
Fig. 5.
Fig. 6.
Fig. 7.
Fig. 8.
Fig. 9.
Fig. 10.
Graphical abstract
| density | Fe-7Mn-0Ta | Fe-7Mn-1.0Ta | Fe-7Mn-1.5Ta |
|---|---|---|---|
| theoretical (g/cm3) | 7.83 | 7.92 | 7.96 |
| measured (g/cm3) | 7.872±0.011 | 7.957±0.023 | 8.006±0.034 |
| relative (%) | 100 | 100 | 100 |
| Point | Location | Fe | Mn | Ta | C | O |
|---|---|---|---|---|---|---|
| P1 | Particle | 49.39 | 4.11 | 10.06 | 34.06 | 2.39 |
| M1 | Matrix | 75.46 | 5.83 | 0.58 | 17.14 | 1.00 |
Table 1.
Table 2.
TOP
