
Articles
- Page Path
- HOME > J Powder Mater > Volume 32(3); 2025 > Article
-
Research Article
- The Effect of Aluminum Powder Size on the Structure and Mechanical Properties of Foam
- Seunghyeok Choi1, Sungjin Kim1, Tae-Young Ahn2, Yu-Song Choi2, Jae-Gil Jung1, Seung Bae Son1,*, Seok-Jae Lee1,*
-
Journal of Powder Materials 2025;32(3):232-243.
DOI: https://doi.org/10.4150/jpm.2025.00157
Published online: June 30, 2025
1Department of Advanced Materials Engineering, Jeonbuk National University, Jeonju 54896, Republic of Korea
2Agency for Defense Development, Yuseong, P.O. Box 35–41, Daejeon 305–600, Republic of Korea
-
*Corresponding author: Seung Bae Son E-mail: minikid@jbnu.ac.kr
*Corresponding author: Seok-Jae Lee E-mail: seokjaelee@jbnu.ac.kr
© The Korean Powder Metallurgy & Materials Institute
This is an Open Access article distributed under the terms of the Creative Commons Attribution Non-Commercial License (http://creativecommons.org/licenses/by-nc/4.0/) which permits unrestricted non-commercial use, distribution, and reproduction in any medium, provided the original work is properly cited.
- 2,187 Views
- 65 Download
- 2 Crossref
Abstract
- In this study, we analyzed the structural and mechanical properties of aluminum foams fabricated using aluminum powders of varying sizes and mixtures. The effects of sintering and pore structure at each size on the integrity and mechanical properties of the foams were investigated. Structural characteristics were examined using scanning electron microscopy and micro–computed tomography, while mechanical properties were evaluated through compression testing. The experimental results demonstrated that smaller powder sizes improved foam integrity, reduced porosity and pore size, and resulted in thinner cell walls. In combination, these effects increased compressive strength as the powder size decreased. The findings of this study contribute to the understanding and improvement of the mechanical properties of aluminum foams and highlight their potential for use in a wide range of applications.
- This integrated workflow combines descriptor engineering and experimental validation to develop robust machine learning models, offering a powerful tool for guiding the design of high-entropy alloys.
Graphical abstract
- Metal foam is a lightweight material with unique physical, chemical, and mechanical properties that can replace solid metals to achieve weight reduction, cost savings, and increased efficiency [1]. These materials exhibit high specific strength, excellent energy absorption, low density, and effective acoustic damping, making them suitable for lightweight structural applications across various industries. [2-4]. Metal foam is a unique lightweight material that can be fabricated from a variety of metals and alloys, offering weight reduction, cost savings, and enhanced efficiency by replacing solid metals. Common raw materials for metal foams include pure metals such as aluminum, titanium, nickel, and copper, as well as alloys like Cu–Zn–Al, Ni–Ti, Ti–Mg, and stainless steel [5-12]. Among them, aluminum is widely used in engineering due to its abundant availability, low density, good ductility, and high corrosion resistance. These properties make aluminum foam one of the most popular and actively researched types of porous metals [13, 14]. While retaining the intrinsic properties of aluminum, the internal porous structure of aluminum foam provides high specific strength and excellent energy absorption. Additionally, it offers distinctive features such as low weight, good thermal and electrical conductivity, vibration damping, and acoustic absorption [14-17]. Aluminum foams, in particular, have attracted increasing attention due to their low density, high surface area, excellent thermal and electrical conductivity, high mechanical strength, and electromagnetic interference (EMI) shielding capabilities. These characteristics make them suitable for a wide range of industrial applications, including heat exchangers, exhaust mufflers, catalyst carriers in chemical reactors, high temperature filters, sound barriers, and EMI shielding materials [18-20]. The internal pore structure of aluminum foam allows it to absorb large amounts of energy as the cell walls deform under external loads. This makes it especially valuable in applications such as improving crashworthiness in automobiles, providing shock protection in aerospace and military equipment, enhancing seismic resistance and vibration damping in architectural structures, and serving as packaging or soundproofing material [13–15, 21, 22]. Furthermore, aluminum foam is considered environmentally friendly due to its recyclable, fire resistance, and durability in various weather conditions [13].
- Aluminum foam can be manufactured using various methods, including gas injection, melt foaming, and powder metallurgy [23-26]. Among these, the powder sintering method produces porous structures by compressing and sintering metal powders, where the arrangement of the powder particles determining the size and shape of the pores [27].
- Spark plasma sintering (SPS) is an innovative powder metallurgy technique that enables the rapid densification of samples by applying electric current and pressure directly to a mold containing metal powder. This method is widely utilized in the fabrication of nanocrystalline structures, porous materials, ceramics, and iron–based materials due to its advantages, including low sintering temperatures and voltages, fast heating rates, and short holding times [28, 29]. In SPS, particle size has a direct influence on sintering density. Smaller particles lead to higher relative density and hardness due to their larger surface area, which facilitates faster sintering neck formation. Conversely, larger particles tend to create larger interparticle pores, which can decrease the final density and degrade mechanical properties. These characteristics make SPS an especially effective sintering technique for producing nanocrystalline materials and dense metal foams [30-35].
- Aluminum foam is typically fabricated by mixing aluminum powder with a space holder, followed by compaction and sintering. After compaction — often with the addition of small amounts of sintering aids and binders — sintering forms a bonded aluminum matrix, and the space–holders are removed through pre– or post–sintering heat treatment, yielding an open–pore aluminum foam. In the sinter–dissolve process, inorganic salts such as NaCl and CaCl2 are used as space–holders due to their higher melting points than aluminum. Process parameters in the space–holder method significantly influence the microstructure and performance of the final foam. Key variables include the size, shape, volume fraction of the space–holders, compaction pressure, and sintering temperature. The volume fraction directly determines porosity, while compaction pressure and sintering temperature affect interparticle bonding and mechanical properties. Despite its advantages, the space–holder method has certain limitation. First, porosity is constrained when the packing density of the space holders is below 65%, and residual particles may reduce porosity and cause corrosion. Second, large space–holder particles (over 1 mm) are prone to breakage during compaction, making it difficult to produce foams with large pores. Nevertheless, due to its ability to precisely control pore size and shape, the space–holder method remains a widely adopted technique for producing highly porous and functional aluminum foams [13, 36].
- In compression tests of aluminum foams, a characteristic stress–strain curve is typically observed, which can be divided into three distinct regions. The first region is the linear elastic region, where stress increases almost linearly with strain due to the elastic bending of the cell walls. The second region is the plateau region, during which the stress remains nearly constant or increases slightly as the cell structure progressively collapses. In this region, the cell walls act as plastic hinges, allowing large deformations without a significant increase in stress. The final region is the densification region, where the stress rises sharply as the collapsed cell walls come into full contact and the structure can no longer deform without significant resistance [13, 21, 37]. The mechanical properties of aluminum foams are governed by the interplay of several factors, including cell structure and relative density, cell wall thickness, and pore size and shape. By optimizing these parameters, aluminum foams can be tailored to meet the specific performance requirements of various applications [13].
- This study aims to investigate the effect of aluminum powder size on mechanical properties and microstructure of aluminum foam. Although many studies have explored the processing and performance of aluminum foams, the specific influence of powder particle size—particularly across a wide size range—has not been sufficiently addressed. Since particle size directly affects sintering behavior, pore morphology, and mechanical performance, a systematic investigation is essential to better understand and control foam characteristics. In this work, porous aluminum foam was fabricated using the space–holder method, in which aluminum powder was mixed with sodium chloride (NaCl) particles (500 µm) as space–holders and then sintered. The results confirmed that aluminum powder size significantly influences both the mechanical properties and microstructure of the foam, suggesting that optimizing powder size can enhance performance and versatility. Furthermore, this fabrication approach is not limited to aluminum, but can potentially be extended to a broad range of metal or alloy systems, contributing to the design of lightweight and energy–absorbing materials for structural and functional applications.
1. Introduction
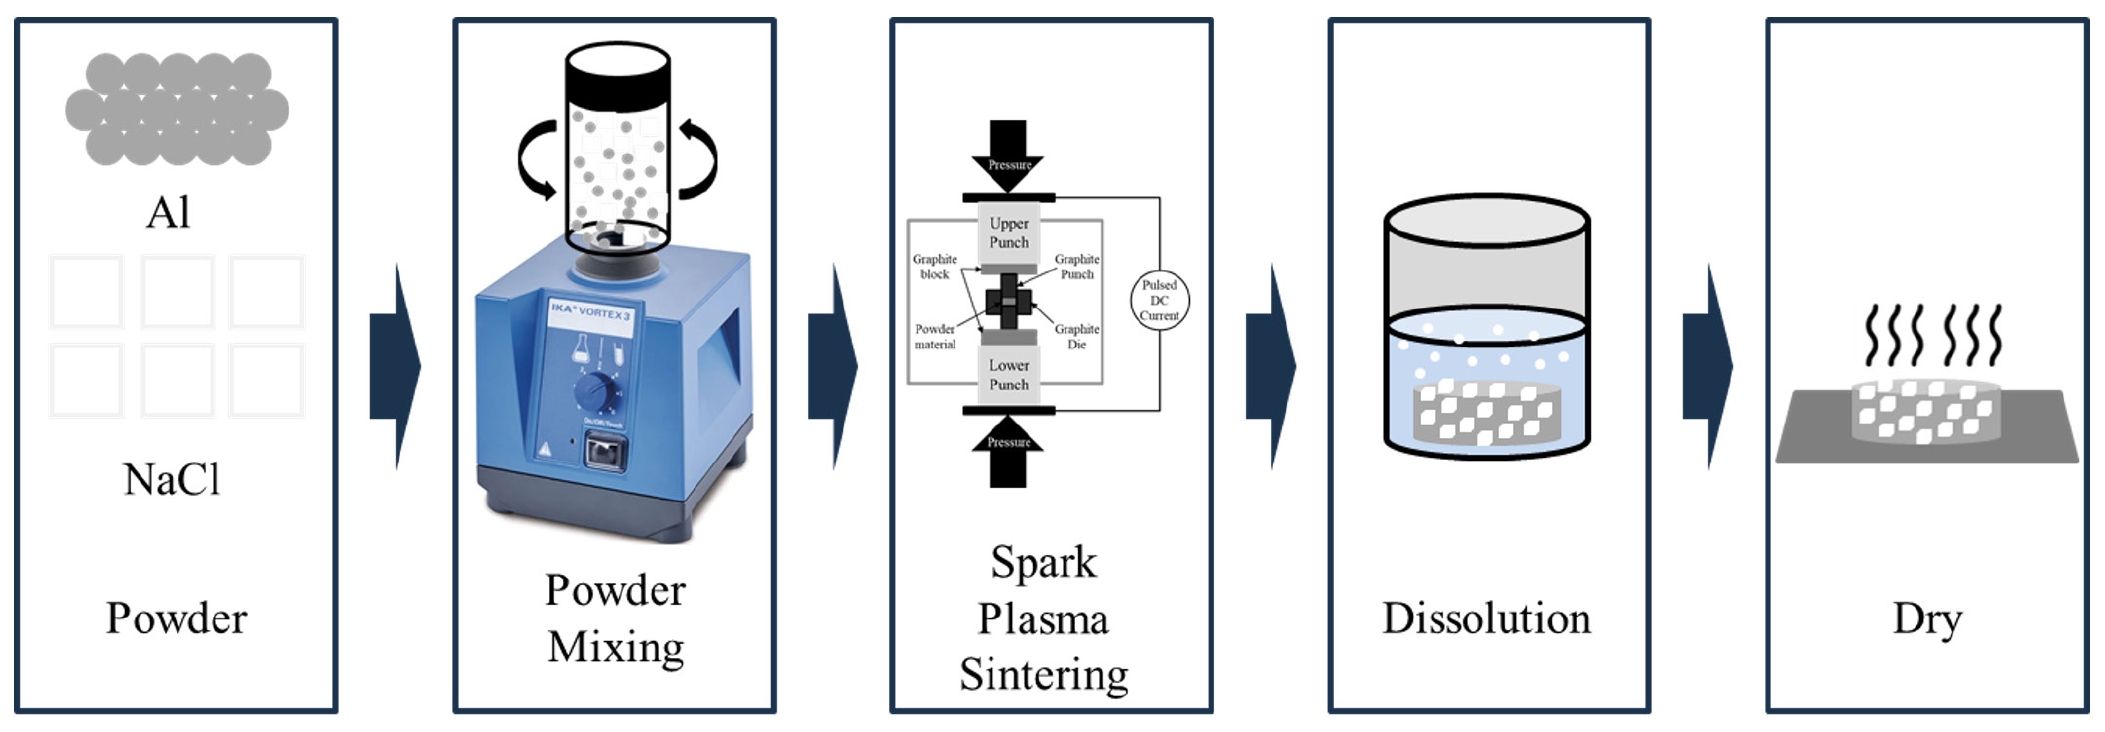
- 2.1 Foam Manufacturing
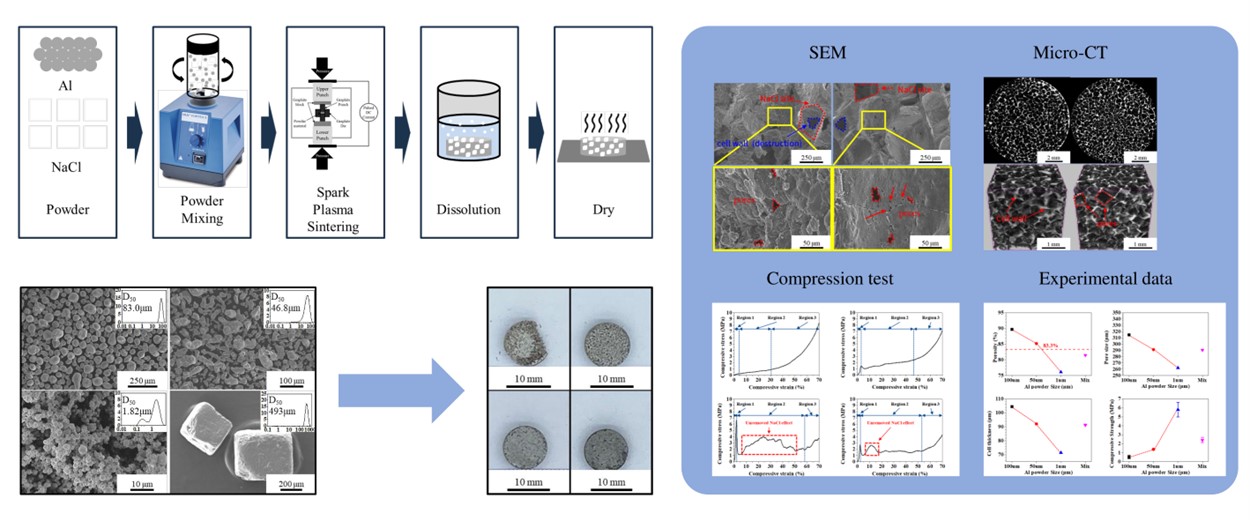
- Aluminum foams were fabricated using the space–holder process, and a schematic of the process is shown in Fig. 1. Sodium chloride (NaCl) was used as the space–holder material. Specifically, 500 µm NaCl (purity 99%, particle size 500 µm, COMSCIENCE) was used, and four types of aluminum powders were prepared: 1 µm (purity 99.9%, particle size 1 µm, AVENTION), 50 µm (purity 99.0%, particle size 200 mesh, SAMCHUN), 100 µm (purity 99.9%, particle size 100 µm, AVENTION), and a 1:1 weight ratio mixture of 1 µm and 100 µm powders. The aluminum powder and NaCl were mixed in a volume ratio of 1:5 using a vortex mixer (IKA, Vortex 3) for approximately 1 minute. The mixed powder was then placed into a graphite mold (35 mm outer diameter, 10 mm inner diameter, 40 mm height), and a uniaxial pressure of 1 MPa was applied using a hydraulic press prior to sintering. Sintering was carried out using spark plasma sintering (SPS) under the following conditions: a heating rate of 50°C/min, sintering temperature of 500°C, holding time 10 minutes, applied pressure of 50 MPa, vacuum level of 150 mTorr, and air cooling. The sintered sample were cylindrical, with a diameter of 10 mm, height of 4.1–4.3 mm, and a weight of approximately 0.8 g. To remove the NaCl space–holder, the sintered samples were immersed in distilled water heated to 60°C for 1 hour. Following this, ultrasonic cleaning was performed in two steps: first in distilled water and then in ethanol, with sonication lasting approximately 15 minutes for each step. The cleaned samples were then dried in a drying oven at 120°C for 1 hour. After drying, the final foam samples had a diameter of 10 mm, a height of 4.1–4.3 mm, and a weight of approximately 0.16g. For each condition, four samples were prepared.
- 2.2 Microstructure Analysis
- The microstructure of the powders and aluminum foams were analyzed using a variable pressure scanning electron microscope (Hitachi, SU3900). The powders were examined to determine the size and morphology of aluminum powder and NaCl, while the foams were analyzed for pore morphology, size and distribution. A particle size analyzer (Malvern Panalytical, Mastersizer 3000) was used to measure the particle sizes of both aluminum and NaCl. X–ray micro–computed tomography (Micro CT; Bruker, SKYSCAN 1272) was employed to characterize the foam in terms of pore size, porosity, cell thickness, overall morphology, and pore structure.
- 2.3 Mechanical Properties
- To evaluate the compressive strength of the aluminum foams, compression tests were conducted at room temperature using a universal testing machine (Instron, 5569). The foam specimens had a diameter of 10 mm and a height ranging from 4.1 to 4.3 mm. Four types of aluminum foams were tested: (1) foam fabricated with 1 µm aluminum powder (hereafter referred to as 1 µm foam), (2) foam fabricated with 50 µm powder (50 µm foam), (3) foam fabricated with 100 µm powder (100 µm foam), and (4) foam fabricated with a 1:1 weight ratio mixture of 1 µm and 100 µm powders (Mix foam). Each test was performed in triplicate for statistical reliability. The strain rate was set at 1×10⁻³ s–1, and the compression was applied up to 70% strain.
2. Experimental Procedure
- 3.1 Powder and Foam Measurement
- Fig. 2. a–d show SEM images and particle size analysis results of the aluminum powders and NaCl. The SEM images illustrate the size and morphology of the aluminum powder and NaCl particles. As observed by SEM, the aluminum powders were approximately 1 µm, 50 µm, and 100 µm in size, with spherical or cylindrical shapes, while the NaCl particles were about 500 µm and exhibited a cubic morphology. To accurately determine particle sizes, a particle size analyzer was used. The D50 values obtained were as follows: 1.82 µm for the 1 µm aluminum powder, 46.8 µm for the 50 µm powder, 83.0 µm for the 100 µm powder, and 493 µm for the 500 µm NaCl. These values were consistent with the observations made from the SEM images, indicating good agreement between the two measurement methods.
- Fig. 3. a–d show images of the fabricated aluminum foams. The foams were categorized based on the aluminum powder used: 100 µm foam (fabricated using 100 µm aluminum powder), 50 µm foam (using 50 µm powder), 1 µm foam (using 1 µm powder), and Mix foam (using a 1:1 weight ratio mixture of 100 µm and 1 µm powders). All foam had a cylindrical shape with a diameter of 10 mm and a height ranging from 4.1 to 4.3 mm. The relative density of each foam was calculated prior to NaCl removal. The densities of aluminum and NaCl are 2.70 g/cm3 and 2.16 g/cm3. Respectively, In the green compact with a 1:5 volume ratio of aluminum to NaCl, 0.16 g of aluminum corresponds to a volume of 0.05926 cm3, and 0.64 g of NaCl corresponds to a volume of 0.2963 cm3. The total volume is therefore 0.35556 cm3, and the total weight is 0.80 g, yielding an overall density of 2.25 g/cm3 for the compact. The measured densities of the sintered foams were: 100 µm foam is 2.15 g/cm3, 50 µm foam is 2.15 g/cm3, 1 µm foam is 2.20 g/cm3, and Mix foam is 2.15 g/cm3. The corresponding relative densities were: 100 µm foam is 95.6%, 50 µm foam is 95.8%, 1 µm foam is 97.6%, and Mix foam is 95.7%. All samples exhibited relative densities greater than 95%, indicating successful sintering. Among them, the 1 µm foam showed highest density, suggesting enhanced particle packing and bonding.
- To confirm the removal of NaCl, the NaCl removal rate was measured and calculated using Eq. (2). The measured removal rates were as follows: the 100 µm foam was not measurable due to peripheral breakage during the NaCl removal process; the 50 µm foam showed 100% removal; the 1 µm foam, 95.24%; and the Mix foam, 96.27%. Incomplete removal of NaCl can be attributed to several factors. First, as the aluminum powder size decreases, the number of aluminum particles surrounding each NaCl particle increases, and the voids between the aluminum powders become smaller. These two factors restrict access to distilled water and hinders the dissolution of NaCl. Second, the height and porosity of the foam also play a critical role. In initial trials, aluminum foams with a height of 10 mm exhibited residual NaCl in the center of the sample. To address this issue, the sample height was reduced to 4 mm and the porosity was increased, which enhanced NaCl removal by improving pore interconnectivity and creating more effective diffusion pathways. Third, increased relative density reduce pore connectivity, further preventing the complete removal of NaCl. Fourth, breakage of NaCl particles during compaction or sintering may result in their entrapment within the matrix. Wan, Tan, et al. reported that space–holder particles are susceptible to breakage during compaction, which can impede their complete elimination [13]. For these reasons, the NaCl removal rate tends to decrease as the aluminum powder size decreases.
- (NaClremoval weight=weightbefore removal NaCl-weightafter removal NaCl)
- Fig. 3. Shows a full image of the fabricated aluminum foams, which were used to evaluate the structural integrity of the foams. For the 100 µm foam, all four samples exhibited partial collapse during the NaCl removal process, with approximately 10% of the total volume affected. In contrast, no collapse was observed in the 50 µm foam, 1 µm foam, or Mix foam. In terms of structural integrity, the 100 µm foam showed the poorest performance while the other foams maintained good integrity. Factors affecting the integrity of the foam include the ratio of aluminum powder size to NaCl size, the volume ratio of aluminum to NaCl, and the sintering conditions. In this study, the sintering conditions and the volume ratio of aluminum to NaCl (1:5) were kept constant across all samples. Therefore, the primary influencing factor was the relative particle size ratio between aluminum powder and the NaCl. The NaCl particle size was fixed at 500 µm, while the aluminum powder sizes were 100 µm, 50 µm, and 1 µm, corresponding to size ratio of aluminum powder to NaCl of 1:5 (100 µm foam), 1:10 (50 µm foam), and 1:500(1 µm foam), respectively. Fig. 4. Illustrates the relative sizes. When converted to volume rations, these become approximately 1:125 (100 µm foam), 1:1000 (50 µm foam), and 1:125,000,000 (1 µm foam). Given the 1:5 aluminum–to–NaCl volume ratio, the number of aluminum particles per NaCl particle increases significantly with decreasing aluminum powder size (approximately 25 for 100 µm, 200 for 50 µm, and 25 million for 1 µm). As the aluminum particle size decreases, the number of aluminum particles surrounding each NaCl particle increase, and the interparticle void size decrease. This reduces the diffusion pathways for distilled water, which is essential for dissolving and removing the NaCl. Consequently, smaller aluminum particles can hinder NaCl removal. Additionally, smaller particles have a higher surface area, promoting faster sintering neck formation and leading to increased relative density [9–14]. While this improves structural integrity, it can also trap NaCl within the matrix, as observed in the 1 µm foam and Mix foam, where NaCl was not completely removed.
- 3.2 Microstructure Measurement Using SEM
- Fig. 5. Shows an SEM image of aluminum foam. The image reveals the size and morphology of the pores, as well as the shape and thickness of the cell walls. The pores can be classified into three types based on their formation mechanisms: (1) pores formed during powder sintering, (2) pores generated by the removal of NaCl, and (3) pores formed by the partial collapse or destruction of the cell wall during NaCl removal. Pores formed during powder sintering are typically smaller than 50 µm and exhibit irregular shapes. As the aluminum powder size decreases, the size of these pores also decreases, owing to the reduced interparticle voids in powders. Pores resulting from NaCl removal are approximately 300–500 µm in size and generally cubic in shape. The fact that they are smaller than the original NaCl particles (500 µm) is attributed to deformation of the NaCl under pressure during sintering [13]. Pores caused by the destruction of the cell walls are irregular in both shape and size, and their occurrence is more noticeable in 50 µm and Mix foams. Overall, the average pore size decreases as the aluminum powder size decreases. Examination of the cell walls shows that aluminum powders are well bonded. In the 100 µm and 50 µm foams, the boundaries between particles are clearly visible, while the 1 µm foam exhibits blurred boundaries or smooth surface. This indicates that finer aluminum powders, with their higher surface area, promote rapid neck formation during spark plasma sintering, leading to improved densification and higher relative density. The thickness of the cell walls also tends to decrease as the aluminum powder size decreases. This is consistent with increased densification achieved through enhanced particle bonding in smaller powders [30-35].
- 3.3 Microstructure Measurement Using Micro–CT
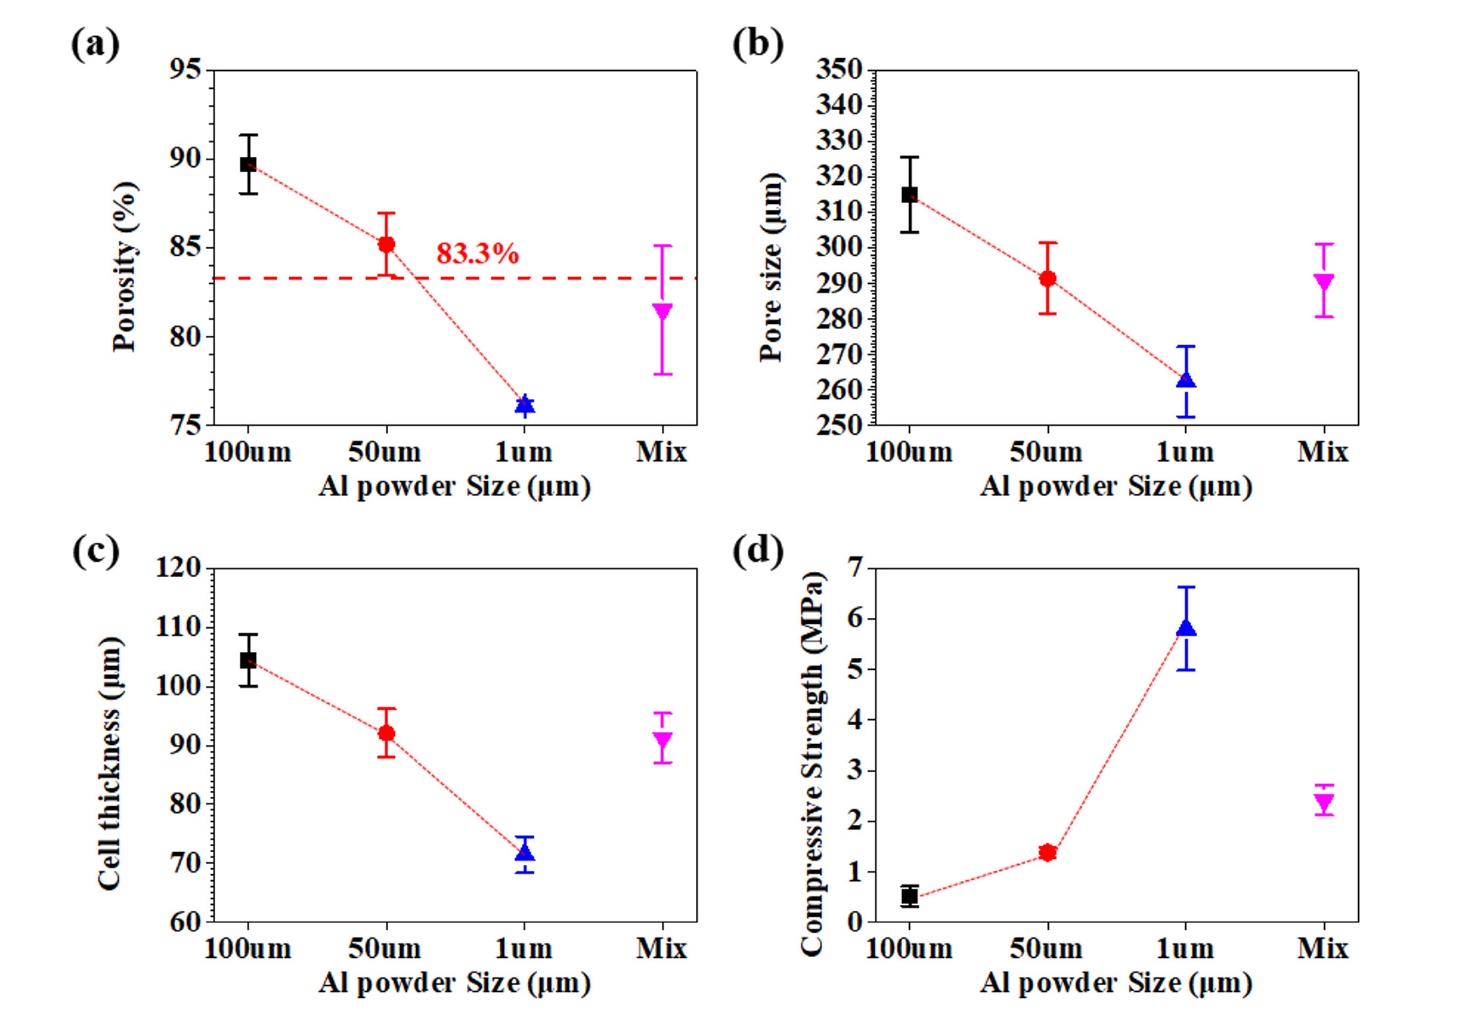
- Fig. 6. a–d shows full 3D images of the aluminum foams, Fig. 6. e–h presents the 2D cross–sectional images and Fig. 6. i–l displays 3D cropped images (3×3×3 mm3) of each foam. In all images, the aluminum cell walls appear as white or gray regions, while the pores are shown in black. Comparison of the 3D images revealed that the 50 µm, 1 µm, and Mix foams maintained good structural integrity, whereas the 100 µm foam exhibited partial collapse and compromised structure. The 2D cross–sectional image clearly show the morphology of the cell walls and pores. The cell walls are formed by the sintering of aluminum powders, and their thickness is influenced by the powder size, which determines the surface area and sintering behavior. As the aluminum powder size decreases, the cell wall thickness tends to decrease due to enhanced densification. In the 100 µm foam, collapse and poor bonding between cell walls were observed, along with reduced interconnectivity. In contrast, the 50 µm, 1 µm, and Mix foams showed well–bonded cell walls and good structural interconnectivity. Pore shapes and sizes were found to be irregular and varied, primarily due to deformation of the NaCl particles under pressure during sintering [13]. The 3D cropped images provided detailed visualization of pore morphology and cell wall structure. Porosity, pore size, and cell wall thickness were quantitatively analyzed using Micro–CT. Porosity was calculated from the full 3D image, while pore size and cell wall thickness were calculated using the 3D cropped image data. This approach was taken because, in the full 3D image of the 100 µm foam, collapsed regions were recognized as pores, which led to overestimation of pore size and inaccurate measurements. By using the 3D cropped images (3×3×3 mm3) and excluding the damaged areas, more accurate and representative values were obtained. The measured porosities of the aluminum foams were 89.70% ± 1.64 for the 100 µm foam, 85.20% ± 1.77 for the 50 µm foam, 76.10% ± 0.28 for the 1 µm foam, and 81.50% ± 3.60 for the Mix foam. The predicted porosity based on the volume ratio of aluminum to NaCl (1:5) was 83.3%. The 100 µm and 50 µm foams showed higher porosities than predicted, while the 1 µm and Mix foams showed lower porosities. In the 100 µm foam, collapsed areas were recognized as pores, resulting in a higher than predicted porosity. For 50 µm foam, all NaCl was removed, but the porosity was higher than the predicted porosity due to internal pores identified by the relative density after sintering. The Mix foam, despite a relative density similar to the 50 µm foam, retained some NaCl, lowering its porosity. The 1 µm foam exhibited the lowest porosity due to both its high relative density and is retained some NaCl. The average pore sizes obtained from micro–CT were 315.01±10.615 µm for 100 µm foam, 291.37±9.954 µm for 50 µm foam, 262.34±9.866 µm for 1 µm foam, and 290.85±10.373 µm for Mix foam. In all cases, the pore sizes were smaller than the original NaCl particle size (500 µm), primarily due to deformation under pressure during sintering, partial destruction of cell walls during NaCl removal, and additional pores formed during sintering. SEM analysis confirmed that pore size decreases with decreasing aluminum powder size, consistent with the micro–CT results. The measured cell wall thicknesses were 104.45±4.363 µm for 100 µm foam, 92.06±4.094 µm for 50 µm foam, 71.51±3.085 µm for 1 µm foam, and 91.26±4.144 µm for Mix foam. Cell wall thickness is affected by both the number and size of aluminum powders, as well as the degree of densification during sintering. Smaller powders result in larger surface areas, which accelerate neck formation and enhance densification, thereby reducing cell wall thickness. SEM images supported this trend, showing blurred boundaries and smoother surface as the powder size decreased. In summary, as the aluminum powder size decreases, porosity, pore size, and cell wall thickness all decrease, reflecting enhanced densification and sintering behavior, as confirmed by both SEM and micro–CT analysis.
- 3.3 Compression Test
- Fig. 7. a–d shows the compression test curves of the aluminum foams. The stress–strain behavior of aluminum foam under compression can be divided into three regions: the elastic region, the plateau region, and the densification region [21, 37]. Region 1 corresponds to the elastic region, which is characterized by a linear elastic region with very low strain. Region 2 is the plateau region, where the pores collapse occurs and strain increases with little to no increase in stress. In this region, both the 1 µm foam and Mix foam exhibit noticeable fluctuations, which are attributed to the presence of unremoved NaCl particles. The residual NaCl induced localized fracture during compression, resulting in fluctuations in the curve. The 1 µm foam exhibits greater fluctuations than the Mix foam, indicating a larger amount of residual NaCl. Region 3 is the densification region, where the previously collapsed pores are compacted, leading to a rapid increase in compressive stress. The compressive strength was determined as the average of the maximum values in region 1, and the Young’s modulus was calculated from the slope of the stress–strain curve in region 1 just before reaching the compressive strength [38]. The measured compressive strengths and Young’s modulus of the foams were 0.523±0.198 MPa and 0.023±0.0036 GPa, for 100 µm foam, 1.386±0.099 MPa and 0.735±0.184 GPa for 50 µm foam, 5.804±0.822 MPa and 3.841±0.917 GPa for 1 µm foam, and 2.419±0.297 MPa and 1.761±0.290 GPa for Mix foam. As the aluminum powder size decreases, the compressive strength increases. Notable, the Mix foam exhibits a higher compressive strength than the 50 µm foam, indicating a synergistic effect from combining fine and coarse powders. This enhancement is likely attributed to improved particle packing, where fine powders fill the voids between coarse powders, resulting in better interparticle contact and more uniform pore wall formation during sintering. Therefore, the mixed powder approach provides an effective strategy to enhance mechanical performance while maintaining microstructural stability. The compressive strength of aluminum foam is influenced by several factors, including porosity, pore size, and cell wall thickness, as reported in previous studies [4, 39-41].
- Fig. 8. a–d shows the relationships between aluminum powder size and four key parameters: porosity, pore size, cell thickness, and compressive strength. As the aluminum powder size decreases, the porosity, pore size, and cell wall thickness also decrease, whereas compressive strength increases. To evaluate the effects of these parameters on compressive strength, predictive equations were employed. Based on the classical and widely accepted Gibson–Ashby model, the relationship between porosity and strength was formulated using an exponential or powder–law function. The remaining variables —pore size, cell wall thickness, and powder size — were incorporated according to their physical relevance, as represented in Eq. (3). Regression analysis using the Ordinary Least Squares (OLS) method conducted to calibrate the coefficients A, n, α, and β in Equation 3 based on the experimental data. These coefficients quantitatively describe the influence of each variable on compressive strength. The results of the regression analysis indicate that strength increases with lower porosity, thicker cell walls, smaller powder size, and smaller pore size. Among these, porosity has the most significant influence, followed by pore size, with cell wall thickness and powder size exhibit relatively minor effects. In addition to its direct influence, aluminum powder size indirectly affects strength by altering microstructural features such as porosity, pore size, and cell thickness. Therefore, mechanical properties of the foam can be effectively controlled by tuning the relative size of aluminum powder to NaCl in the space–holder method. This approach can be extended to a wide range of metallic materials, not limited to aluminum, offering a flexible and scalable strategy for optimizing the mechanical performance of metal foams.
- σc: predicted compressive strength of the foam (MPa), A: 3390 (constant)
- P:
- n, α, β: indexes estimated by regression based on experimental data
- n=2.50, α=0.05, β=0.54
- The compressive strengths calculated using Eq. (3) were compared with the experimental results presented in Table 2. For the 100 µm foam, the calculated strength was 0.518MPa, while the experimental value was 0.523MPa, resulting in an error of 0.96%. For the 50 µm foam, the calculated strength was 1.376 MPa, while the experimental value was 1.386 MPa, resulting in an error of 0.72%. For the 1 µm foam, the calculated strength was 5.788 MPa, while the experimental value was 5.804 MPa, resulting in an error of 0.28%. For the Mix foam, the calculated strength was 2.403 MPa, while the experimental value was 2.419 MPa, resulting in an error of 0.66%. With relative errors ranging from 0.28% to 0.96%, the predicted values are in good agreement with the experimental results, supporting the applicability of Eq. (3) for modeling compressive behavior in open–cell aluminum foams.
3. Results and Discussion
- In this study, the effects of porosity, pore size, and cell wall thickness on mechanical properties of aluminum foams were investigated in relation to aluminum powder size and powder mixing, using NaCl as a space–holder.
- 1. Densification, structural integrity, and NaCl removal efficiency were compared as a function of aluminum powder size. As the powder size decreased, the relative density increased, indicating enhanced densification. Conversely, larger aluminum powders exhibited lower structural integrity due to insufficient sintering. However, a decrease in powder size also resulted NaCl removal rate, attributed to the increased densification, which hinders diffusion pathways.
- 2. SEM analysis was conducted to compare the pore structures and cell walls with different aluminum powder sizes. Three types of pores were identified: (1) pore formed by the removal of NaCl, (2) pores generated by the destruction of cell walls during the NaCl removal, and (3) pores originating from interparticle voids during sintering. Pore size was found to decrease with decreasing aluminum powder size. Cell wall morphology also varied with powder size: clear boundaries between particles were observed in the 100 µm and 50 µm foams, while blurred boundaries and smoother surfaces appeared in the 1 µm foam. These results suggest that smaller powders increase surface area, and enhance neck formation during sintering, promoting densification.
- 3. Micro–CT analysis was used to quantitatively assess porosity, pore size, and cell wall thickness. All three parameters decreased as the aluminum powder size decreased. These trends were consistent with SEM observations and are influenced by factors such as densification, NaCl removal rate, interparticle voids, and pressure–induced NaCl deformation. The results align well with relative density measurements and visual evaluations of structural integrity.
- 4. Compression testing was performed to evaluate mechanical properties across the different foams. The stress–strain curves revealed three characteristic regions. In the plateau region (Region 2) fluctuations were observed in the 1 µm and Mix foams due to incomplete NaCl removal, with more pronounced fluctuations in the 1 µm foam. Compressive strength increased with decreasing aluminum powder size. A regression analysis was performed to determine the influence of each microstructural parameter on strength. The results showed that strength increases with decreasing porosity, decreasing pore size, decreasing powder size, and increasing cell wall thickness. Among these, porosity had the most significant effect, followed by pore size, with cell wall thickness and powder size exhibit relatively minor effects.
- This study demonstrates that aluminum powder size plays a critical role in determining the microstructure and mechanical performance of aluminum foams. By optimizing powder size and mixing strategies, the mechanical properties of aluminum foams can be significantly improved. Moreover, the finding and methodology of this study can be extended to a wide range of metals and alloys beyond aluminum.
4. Conclusion
-
Funding
This work was supported by the Agency for Defense Development of the Korean Government (UI230016TD).
-
Conflict of Interest
The corresponding author (Prof. Seok-Jae-Lee) currently serves on the editorial board of JPM, but was not involved in any part of the publication process. Other than this, the authors declare that they have no relevant potential conflicts of interest.
-
Data Availability Statement
Data will be made available on request.
-
Author Information and Contribution
Seunghyeok Choi: PhD candidate; writing–original draft.
Sungjin Kim: PhD candidate; experiment.
Tae-Young Ahn: Senior Researcher; formal analysis.
Yu-Song Choi: Principal Researcher; formal analysis.
Jae-Gil Jung: Professor; investigation.
Seung Bae Son: Research Professor; writing-review & editing, supervision.
Seok-Jae Lee: Professor; writing-review & editing, funding acquisition, supervision.
-
Acknowledgments
None.
Article information


- 1. R. Kumar, H. Jain, S. Sriram, A. Chaudhary, A. Khare, V. A. Ch and D. P. Mondal: Mater. Chem. Phys., 240 (2020) 122274.Article
- 2. Y. Zhang, T. Jin, S. Li, D. Ruan, Z. Wang and G. Lu: Int. J. Mech. Sci., 151 (2019) 622.Article
- 3. Y. Chen, R. Das and M. Battley: Int. J. Eng. Sci., 120 (2017) 220.Article
- 4. Y. Chen, R. Das and M. Battley: Int. J. Solids Struct., 52 (2015) 150.Article
- 5. T. Miyoshi, M. Itoh, S. Akiyama and A. Kitahara: Adv. Eng. Mater., 2 (2000) 179.Article
- 6. D. P. Mondal, M. Patel, H. Jain, A. K. Jha, S. Das and R. Dasgupta: Mater. Sci. Eng. A, 625 (2015) 331.Article
- 7. Q. Wang, X. Wang, B. Liu, G. Yu, X. Hou, D. Chen and G. Shen: J. Mater. Chem. A, 1 (2013) 2468.Article
- 8. M. A. El–Hadek and S. Kaytbay: Int. J. Mech. Mater. Des., 4 (2008) 63.ArticlePDF
- 9. A. K. Barnwal, D. P. Mondal, R. Kumar, N. Prasanth and R. Dasgupta: J. Mater. Eng. Perform., 27 (2018) 1450.ArticlePDF
- 10. J. Y. Xiong, Y. C. Li, X. J. Wang, P. D. Hodgson and C. E. Wen: J. Mech. Behav. Biomed. Mater., 1 (2008) 269.Article
- 11. C. E. Wen, M. Mabuchi, Y. Yamada, K. Shimojima, Y. Chino and T. Asahina: Scr. Mater., 45 (2001) 1147.Article
- 12. D. P. Mondal, H. Jain, S. Das and A. K. Jha: Mater. Des., 88 (2015) 430.Article
- 13. T. Wan, Y. Liu, C. Zhou, X. Chen and Y. Li: J. Mater. Sci. Technol., 62 (2021) 11.Article
- 14. E. Liu, Y. Bai, M. Su, J. Li, Y. Hu, R. Ling and H. Hao: Int. J. Mech. Sci., 265 (2024) 108886.Article
- 15. X. Liu, Y. Wang, X. He, H. Liu and S. Cao: Compos. Struct., 327 (2024) 117684.Article
- 16. K. Stöbener, D. Lehmhus, M. Avalle, L. Peroni and M. Busse: Int. J. Solids Struct., 45 (2008) 5627.Article
- 17. H. C. Madhu and S. V. Kailas: Mater. Lett., 357 (2024) 13578.
- 18. J. Banhart: Prog. Mater. Sci., 46 (2001) 559.Article
- 19. H. Bafti and A. Habibolahzadeh: Mater. Des., 31 (2010) 4122.Article
- 20. Z. Xu and H. Hao: J. Alloys Compd., 617 (2014) 207.Article
- 21. J. Yuan, X. Chen, W. Zhou and Y. Li: Compos. Part B Eng., 79 (2015) 301.Article
- 22. K. A. Brekken, M. S. Bakk, S. Dey, T. Berstad, A. Reyes and T. Børvik: Mater. Lett., 351 (2023) 135083.Article
- 23. Y. Cheng, Y. Li, X. Chen, T. Shi, Z. Liu and N. Wang: Metall. Mater. Trans. B, 48 (2017) 754.ArticlePDF
- 24. N. Wang, X. Chen, Y. Li, Z. Liu, Z. Zhao, Y. Cheng and H. Zhang: Colloids Surf. A, 527 (2017) 123.Article
- 25. X. Ding, Y. Liu, X. Chen, H. Zhang and Y. Li: Mater. Lett., 216 (2018) 38.Article
- 26. J. Banhart: Prog. Mater. Sci., 46 (2001) 5559.
- 27. B. Arifvianto and J. Zhou: Mater., 7 (2014) 3588.Article
- 28. S. J. Oh, B. C. Kim, M. C. Suh, I. J. Shon and S. J. Lee: Arch. Metall. Mater., 64 (2019) 863.
- 29. S. J. Oh, D. Park, K. Kim, I. J. Shon and S. J. Lee: Mater. Sci., 725 (2018) 382.Article
- 30. Y. Cheng, Z. Cui, L. Cheng, D. Gong and W. Wang: Adv. Powder Technol., 28 (2017) 1129.Article
- 31. S. Diouf and A. Molinari: Powder Technol., 221 (2012) 220.Article
- 32. J. H. Shon, I. B. Song, K. S. Cho, Y. I. Park, J. K. Hong, N. K. Park and M. H. Oh: Int. J. Precis. Eng. Manuf., 15 (2014) 643.ArticlePDF
- 33. C. Velmurugan, V. Senthilkumar, K. Biswas and S. Yadav: Adv. Powder Technol., 29 (2018) 2456.Article
- 34. G. M. Le, A. Godfrey and N. Hansen: Mater. Des., 49 (2013) 360.Article
- 35. M. B. Shongwe, M. M. Ramakokovhu, S. Diouf, M. O. Durowoju, B. A. Obadele, R. Sule and P. A. Olubambi: J. Alloys Compd., 678 (2016) 241.Article
- 36. S. Kim, S. Choi, T. Y. Ahn, Y. S. Choi, J. G. Jung, S. B. Son and S. J. Lee: Met. Mater. Int., 1 (2025) 1.
- 37. H. Bafti and A. Habibolahzadeh: Mater. Des., 52 (2013) 404.Article
- 38. E. Rupérez, J. M. Manero, K. Riccardi, Y. Li, C. Aparicio and F. J. Gil: Mater. Des., 83 (2015) 112.
- 39. W. Zhai, J. Yu, L. Wu, W. Ma and J. W. He: Polymer, 47 (2006) 7580.Article
- 40. K. M. Lewis, I. B. A. O. S. Kijak, K. B. Reuter and J. B. Szabat: J. Cell. Plast., 32 (1996) 235.ArticlePDF
- 41. G. F. Smits: J. Therm. Insul. Build. Envel., 17 (1994) 309.ArticlePDF
References
Figure & Data
References
Citations
- Sustainable Manufacturing of Graphene–Aluminum Composites: A Comparative Life Cycle Assessment
Xinwei Yang, Qian Peng, Changke Chen, Qingcui Liu, Yudai Huang
Journal of Sustainable Metallurgy.2026; 12(1): 727. CrossRef - Effect of powder size and sintering time on the induction sintering behavior of aluminum fabricated by UHFIS
Hıdır Sercan Çubuk
Turkish Journal of Engineering.2026; 10(2): 396. CrossRef
 ePub Link
-
 Cite this Article
- Cite this Article
-
- Close
- Download Citation
- Close
- Figure
-


- Related articles
-
- Effect of Bimodal WC Particle Size Distribution on the Mechanical Properties of WC–Mo2C–Co Cemented Carbides
- Effect of Hatch Spacing on the Microstructure and Mechanical Properties of SA508 Gr.3 Steel Fabricated by Laser Powder Bed Fusion
- Effect of the Cross-rolling Process on the Microstructures and Mechanical Properties of 9Cr-1W ODS Steel
- Effect of Sintering Conditions on the Microstructure of an FeCrMnNiCo High-Entropy Alloy
- Fabrication of 3D Aligned h-BN based Polymer Composites with Enhanced Mechanical Properties for Battery Housing

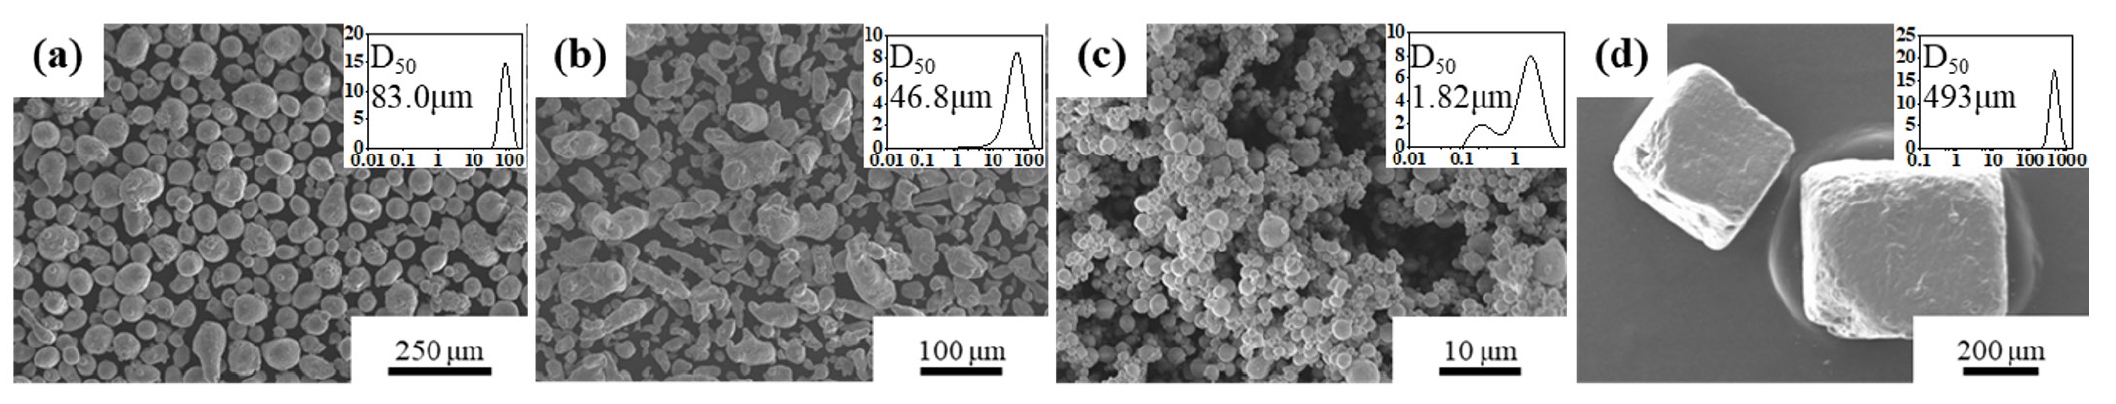
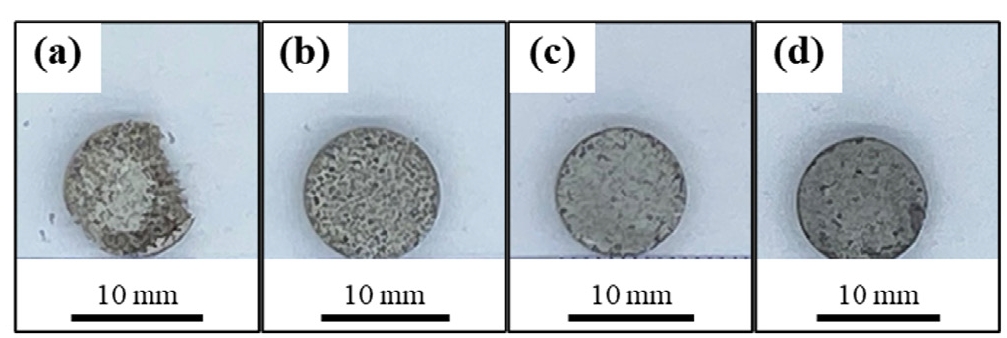
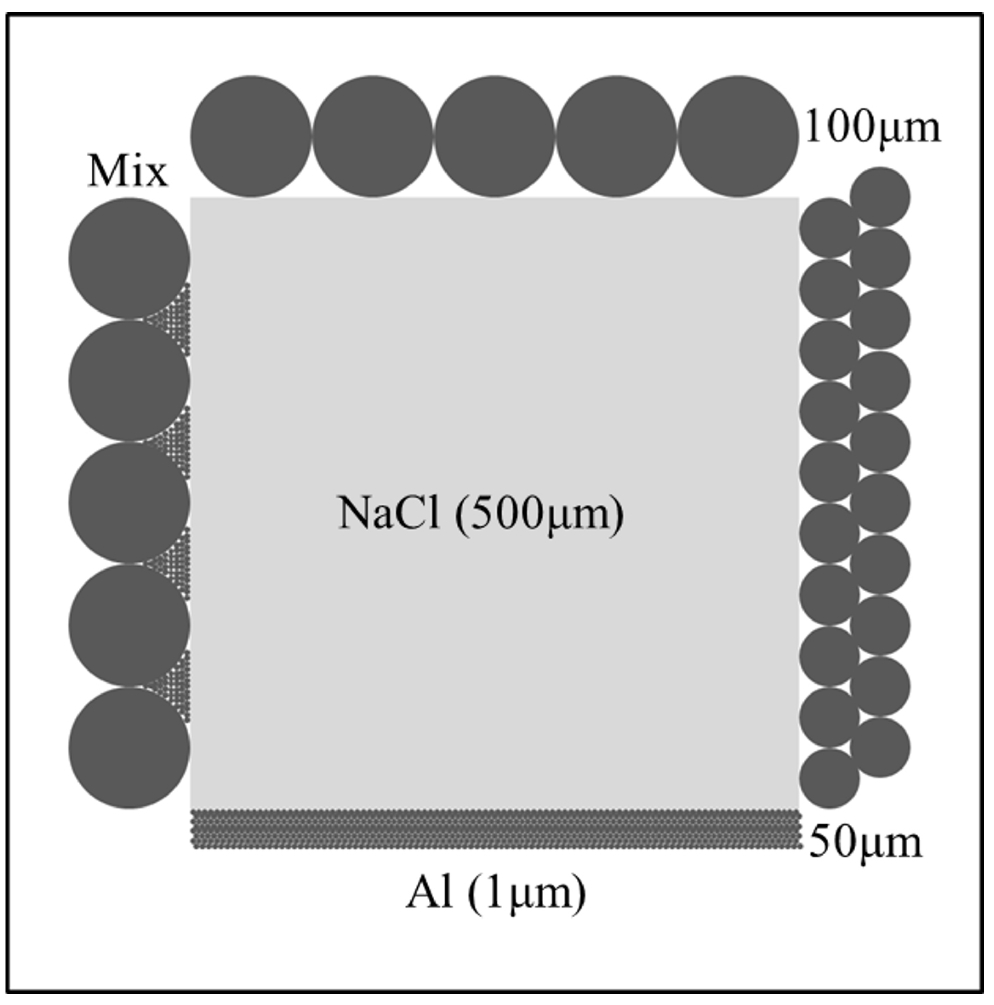
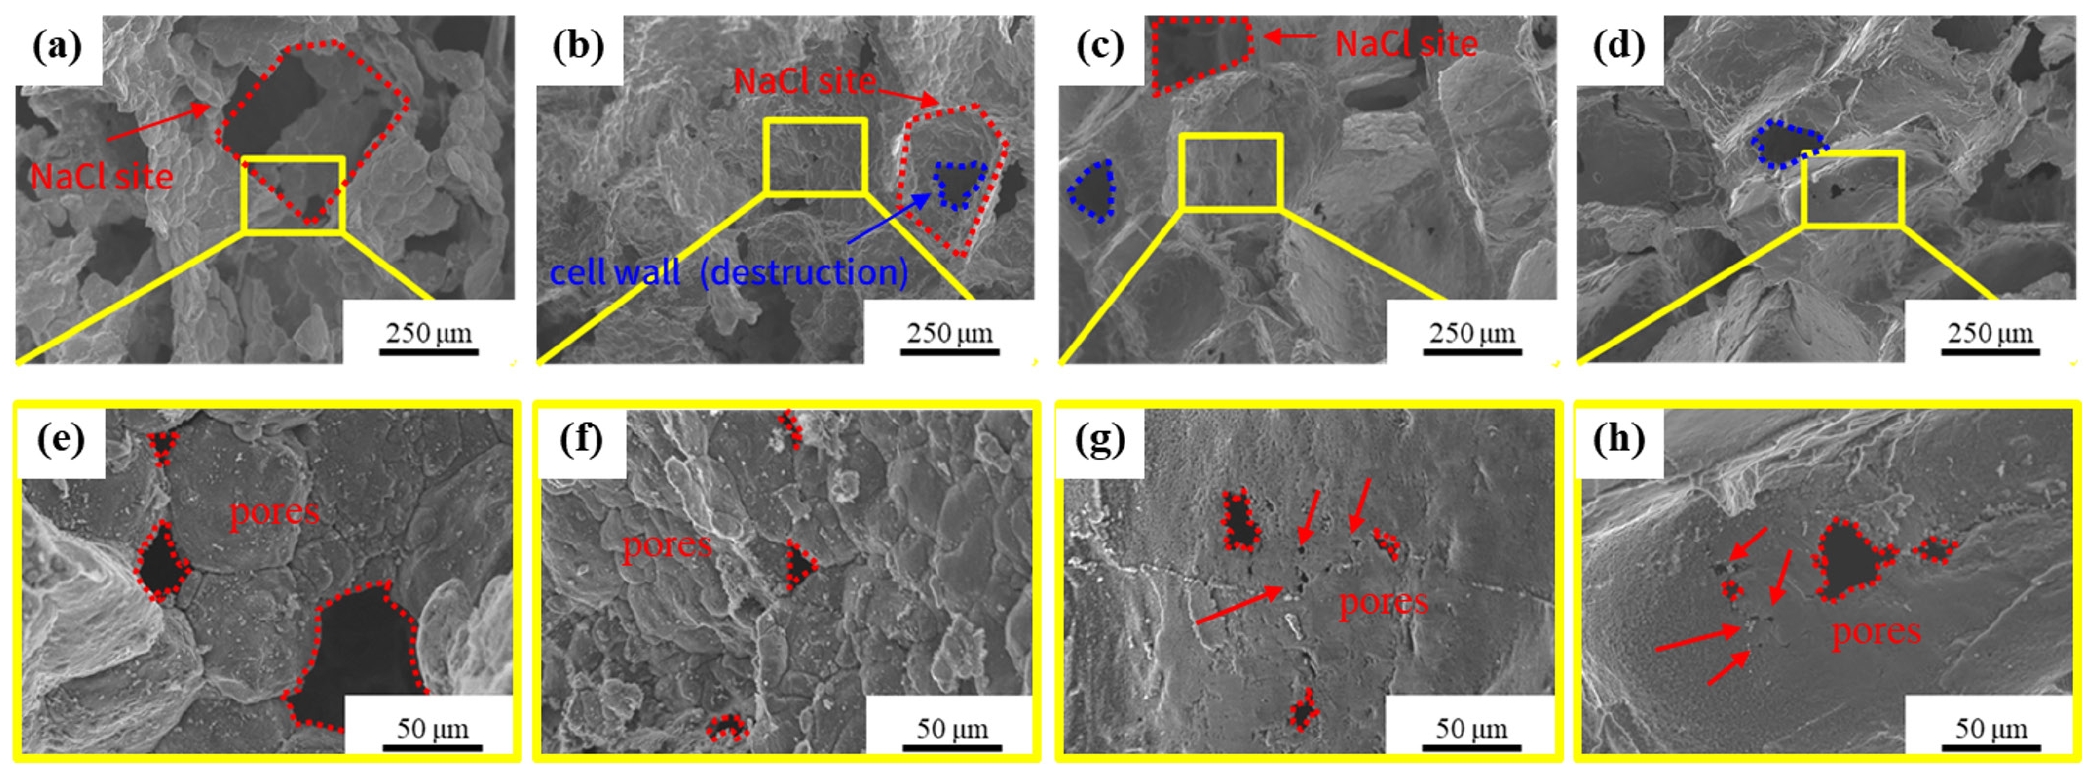
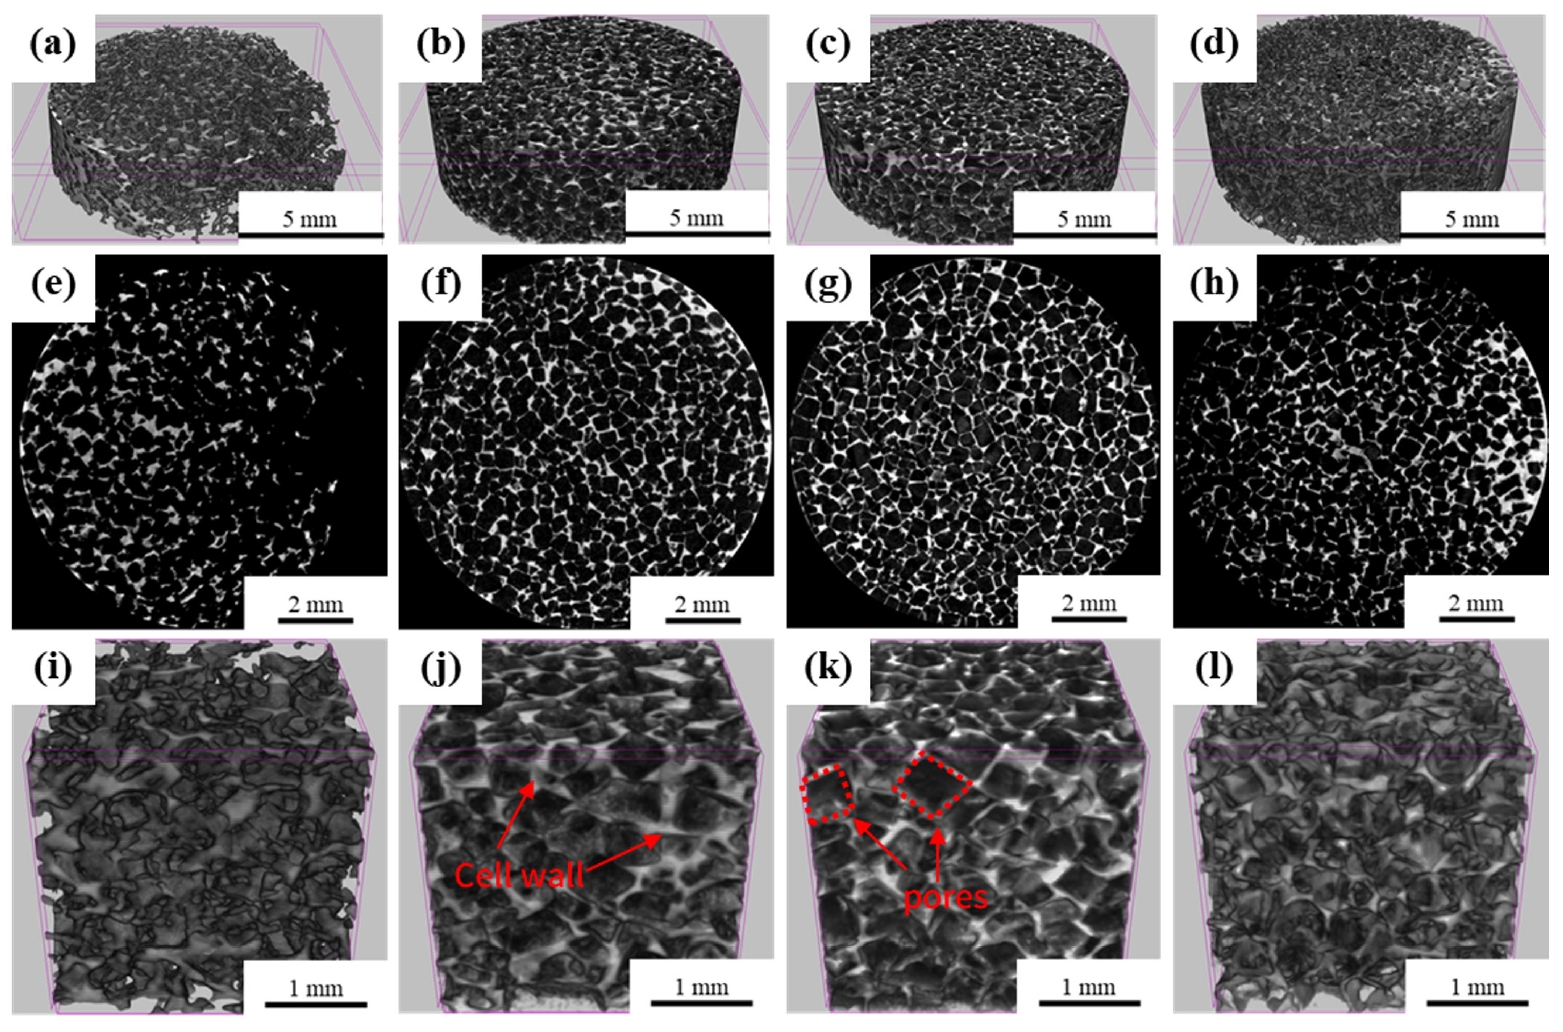
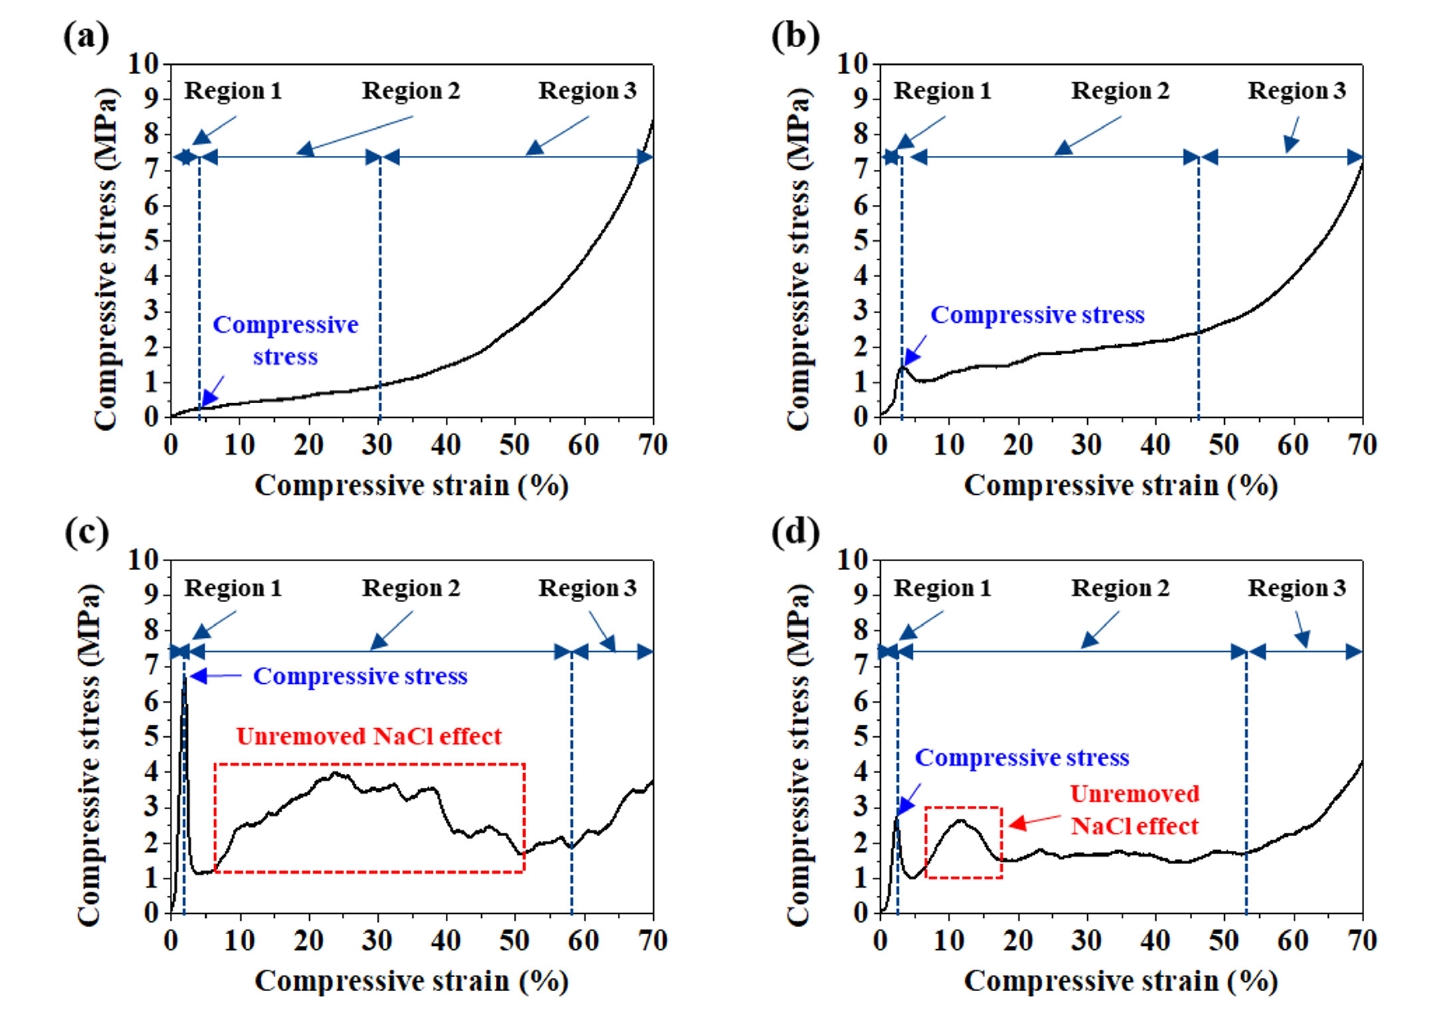


Fig. 1.
Fig. 2.
Fig. 3.
Fig. 4.
Fig. 5.
Fig. 6.
Fig. 7.
Fig. 8.
Graphical abstract
| 100 μm foam | 50 μm foam | 1 μm foam | Mix foam | |
|---|---|---|---|---|
| Experiment density (g/cm3) | 2.15 | 2.15 | 2.20 | 2.15 |
| Theoretical density (g/cm3) | 2.25 | |||
| Relative density (%) | 95.6 | 95.8 | 97.6 | 95.7 |
| NaCl removal rate (%) | X | 100 | 95.24 | 96.27 |
| 100 μm foam | 50 μm foam | 1 μm foam | Mix foam | |
|---|---|---|---|---|
| Porosity (%) | 89.70±1.64 | 85.20±1.77 | 76.10±0.28 | 81.50±3.60 |
| Pore size (μm) | 315.04±10.612 | 291.37±9.954 | 262.34±9.866 | 290.85±10.373 |
| Cell thickness (μm) | 104.45±4.363 | 92.06±4.094 | 71.51±3.085 | 91.26±4.144 |
| Compressive strength (MPa) | 0.523±0.198 | 1.386±0.099 | 5.804±0.822 | 2.419±0.297 |
| Young’s modulus (GPa) | 0.023±0.0036 | 0.735±0.184 | 3.841±0.917 | 1.761±0.290 |
100 μm foam: foam fabricated using 100 μm aluminum powder. 50 μm foam: foam fabricated using 50 μm aluminum powder. 1 μm foam: foam fabricated using 1 μm aluminum powder. Mix foam: foam fabricated by mixing 100 μm aluminum powder with 1 μm aluminum powder.
100 μm foam: foam fabricated using 100 μm aluminum powder. 50 μm foam: foam fabricated using 50 μm aluminum powder. 1 μm foam: foam fabricated using 1 μm aluminum powder. Mix foam: foam fabricated by mixing 100 μm aluminum powder with 1 μm aluminum powder.
Table 1.
Table 2.
TOP
