
Articles
- Page Path
- HOME > J Powder Mater > Volume 33(1); 2026 > Article
-
Research Article
- The Optimization of L-PBF Process for Economical & High Performance Using SiO2 Nanoparticle-Coated Non-Spherical Ti Powder
-
Taehu Kang, Ukju Gim, Sehun Kim, Jongik Lee, Sanghee Jeong, Jimin Han, Bin Lee*

-
Journal of Powder Materials 2026;33(1):22-36.
DOI: https://doi.org/10.4150/jpm.2026.00024
Published online: February 28, 2026
Department of Advanced Materials Engineering Kyung Hee University, Yongin-si, 17104, Republic of Korea
- *Corresponding author: Bin Lee E-mail: leebin@khu.ac.kr
© The Korean Powder Metallurgy & Materials Institute
This is an Open Access article distributed under the terms of the Creative Commons Attribution Non-Commercial License (http://creativecommons.org/licenses/by-nc/4.0/) which permits unrestricted non-commercial use, distribution, and reproduction in any medium, provided the original work is properly cited.
- 1,842 Views
- 27 Download
Abstract
- In laser powder bed fusion (L-PBF), a metal powder–based additive manufacturing process, pure titanium powders rely on expensive gas-atomized spherical powders, which poses a significant limitation of material cost. In contrast, non-spherical titanium powders are more cost-effective but their application in L-PBF is restricted their use due to poor flow property and high oxygen content. In this study, a powder mixing strategy with spherical titanium and hydrophobic SiO2 nanoparticle is proposed to improve the flowability and process stability of non-spherical Ti powders. After evaluating flow properties at various mixing ratios, a spherical-to-non-spherical Ti ratio of 4:6 was selected, with SiO2 nanoparticles added during mixing. The uniform distribution of oxide nanoparticles on the powder surfaces was confirmed by SEM and EDS. A maximum relative density of 99.7% was shown by specimens made with L-PBF under various processing parameters. The specimens obtained a tensile strength of 762.6 ± 3.8 MPa and an elongation of 22.1 ± 0.7% at a volumetric energy density of 71.4 J/mm³. This study demonstrates the application of low-cost non-spherical Ti powders in L-PBF is feasible and presents an effective way to simultaneously increase process stability and economic efficiency in titanium additive manufacturing.
- In this study, a particle shape control process was developed to fabricate flake-like SUS316L powders (~20 µm). Adding 5 wt% PVP to a DI water solvent produced more uniform flake-shaped particles, reduced oxygen content, and showed minimal crystallinity degradation.
Graphical abstract
- Additive Manufacturing (AM) is a technology that enables the direct fabrication of components with desired geometries using metal powders, without relying on conventional metal manufacturing processes such as casting, mold fabrication, and subtractive machining. By slicing three-dimensional (3D) CAD model data into two-dimensional (2D) planar layers and sequentially depositing powder material using a 3D printer, complex geometries can be manufactured with relative ease (Fig. 1). Since this process does not require expensive tooling or molds, it is particularly well suited for high-mix, low-volume production and has therefore attracted considerable attention [1, 2].
- According to ASTM standards, additive manufacturing processes are categorized into seven distinct types [3]. Among these, the Laser Powder Bed Fusion (L-PBF) process involves the formation of a powder layer with a thickness on the order of several tens of micrometers on a powder bed, followed by selective melting and additive manufacturing using a laser or electron beam to fabricate the desirous geometry. The L-PBF process, based on its high design freedom and production efficiency, is widely used for forming three-dimensional structures and producing prototypes of Ti, Al, and Ni-based metal materials that are difficult to process at room temperature [4, 5].
- Titanium and titanium alloys are continuously expanded their applications as structural materials and biomaterials due to their high specific strength, lightweight properties, excellent high-temperature stability, and biocompatibility [6-8]. The α+β titanium alloys (e.g., Ti-6Al-4V) exhibit a dual-phase microstructure in which the α and β phases coexist, providing an excellent balance between strength and ductility [9, 10]. According to ASTM standards, the tensile strength of the Ti-6Al-4V alloy reaches approximately 895 MPa [11]. In contrast, pure titanium exists as a single α-phase structure at room temperature, limiting active slip planes. This results in relatively low strength and strengthening potential [12, 13], with the tensile strength of ASTM Grade 4 pure titanium reported at approximately 550 MPa [14].
- However, recent studies have confirmed that adding a certain amount of oxygen to pure titanium enhances strength while maintaining elongation at a certain level. Zhang et al. fabricated Ti–O alloys by mechanically mixing pure titanium powder with nanoscale TiO2 to control the oxygen content, followed by L-PBF processing. The Ti–O alloys containing 0.3 wt.% and 0.5 wt.% oxygen exhibited ultimate tensile strengths (UTS) of 746.6 ± 15.3 MPa and 896.7 ± 10.8 MPa, with corresponding elongations of 11.3 ± 3.1% and 4.1 ± 1.8%, respectively. Compared with the UTS (426.8 ± 16.7 MPa) and elongation (15.39 ± 2.3%) of pure titanium, these results confirm that increasing oxygen content leads to enhanced strength accompanied by reduced elongation. This is the result of oxygen atoms dissolved in the matrix causing solution strengthening and grain refinement strengthening, which restricts dislocation movement and increases yield strength [15]. Furthermore, Xu et al. reported that L-PBF processing of pure titanium containing approximately 0.4 wt.% oxygen resulted in a tensile strength of about 876.1 MPa and an elongation of 14.7% [16]. These results indicate that while oxygen addition during L-PBF processing effectively enhances the mechanical strength of pure titanium, it simultaneously tends to reduce ductility. Therefore, an appropriate strategy is required to achieve high mechanical strength without a significant loss of elongation through precise control of oxygen concentration and optimization of processing parameters.
- Spherical titanium powder used in the L-PBF process is typically produced via gas atomization, providing excellent flowability and low oxygen content. However, it suffers from low production yield and high cost. In contrast, non-spherical titanium powder exhibits poor flow properties due to its non-uniform particle size distribution and large surface area [17]. Nevertheless, it offers a significant economic advantage, being approximately 13.3 times less expensive than spherical powder. [18]. Non-spherical titanium powder produced via the hydrogenation-dehydrogenation process has a high oxygen concentration (approximately 1,980 to 8,450 ppm) during dehydrogenation [19]. When non-spherical and spherical powders are used in combination, the non-spherical powder can be effectively employed to control the oxygen concentration to achieve the desired mechanical properties.
- However, our research team confirmed that due to the low flow characteristics of non-spherical powder, simple physical mixing of spherical and non-spherical powders is insufficient for their standalone application in the L-PBF process. To address this limitation, we conducted research to improve the flow characteristics of non-spherical powder. First, based on the assumption that the low flowability of non-spherical titanium powder was caused by moisture adsorbed on its surface, hydrophobic surface treatment was performed using silane-based compounds such as dimethyldichlorosilane (DMDCS) and methyltrichlorosilane (MTCS). In particular, it was confirmed that a strong hydrophobic siloxane layer formed on MTCS-treated HDH titanium powder due to its terminal methyl group. The applicability of this powder in the additive manufacturing process was demonstrated by mixing it with spherical powder at a 1:1 ratio. However, because this approach relies on chemical coating using chemical solvent to create a hydrophobic layer on the powder surface, post-processing steps such as powder drying, filtering, and solvent removal are required for use, leading to additional economic losses [17]. To overcome the drawbacks of hydrophobic coating using chemical solvents, recent research has focused on enhancing powder flowability through the addition of oxide nanoparticles to L-PBF powders. Among these, studies using SiO2 to improve flow properties are particularly well-known.
- N. Emminghaus et al. demonstrated that surface modification of Ti-6Al-4V alloy powder with pyrogenic SiO2 simultaneously improved powder flowability and mechanical properties. However, the pyrogenic process has the disadvantage of requiring extremely high processing temperatures for SiO2 coating [20, 21]. E. Gärtner et al. confirmed that dry-mixed 0.5 wt.% hydrophobic silica into polyethylene powder, simultaneously improving the powder′ s flowability and bulk density. In addition, they dry-mixed 0.1 wt.% hydrophobic silica nanoparticles into LaNi5 powder and confirmed enhanced flowability [22]. Based on this idea, our research team′ s prior work proposed a direction for increasing powder flow properties by dry-mixing SiO2. Gim et al. demonstrated that adding 0.1 wt.% hydrophobic SiO2 nanoparticles to non-spherical Ti-6Al-4V powder via dry mixing, dispersing them on the powder surface, improved flow properties, enabled application in actual additive manufacturing processes, and enhanced mechanical properties [23].
- Therefore, this study aimed to achieve process cost-effectiveness by mixing non-spherical pure titanium powder with spherical powder, while simultaneously enhancing the efficiency of the L-PBF process through improved powder flow characteristics. In this approach, oxygen concentration was controlled to induce improvements in the mechanical properties of pure Ti. As discussed earlier, appropriate control of oxygen content in pure titanium can result in mechanical properties comparable to those of Ti alloys [24-26]. HDH non-spherical Ti powder and spherical Ti powder were mixed at regular intervals with mass ratios ranging from 1:9 to 9:1. Hydrophobic SiO2 nanoparticles were then dry-coated onto the mixture to enhance powder flow properties and additive manufacturing processability. Cubic specimens were then fabricated under various processing conditions using the L-PBF process, and the optimal process parameters were determined based on relative density. The microstructure and phase characteristics of the powders and fabricated specimens were analyzed using scanning electron microscopy (SEM), energy-dispersive spectroscopy (EDS), electron backscatter diffraction (EBSD), and X-ray diffraction (XRD). The mechanical properties of the specimens were evaluated through tensile testing, and the effects of SiO2 nanoparticle addition and crystallographic texture on mechanical performance were systematically investigated. This study aims to propose a powder design strategy that simultaneously achieves stable additive manufacturing and excellent mechanical properties while reducing dependence on expensive spherical powders.
1. Introduction
- 2.1 Powder preparation
- The mixed powder was prepared using non-spherical titanium powder (<45μm, Samhwa Steel, Republic of Korea), spherical titanium powder (<33.3μm, MTIG, Republic of Korea), and SiO2 nanoparticles (SiO2, 6863N, Skyspring Nanomaterials Inc., 5–15 nm, USA). The mixing ratio of non-spherical titanium powder was adjusted in 10% increments within the range of 0–100% and mixed with spherical titanium powder. Based on our previous studies indicating that adding 0.1 wt.% SiO2 resulted in uniform dispersion without powder agglomeration or segregation [23, 27]. Powder mixing and SiO2 coating were performed using a 3D tubular mixer (DTB-2, Daehwa Tech, Republic of Korea) at 300 rpm for 3 hours. This process uniformly dispersed SiO2 nanoparticles on the substrate powder surface, reduced inter-powder agglomeration, and improved flow characteristics. The dispersion of SiO2 on the powder surface was confirmed using Energy Dispersive X-ray Spectroscopy (EDS, Ultim Max 100, Oxford Instruments, UK).
- 2.1 Flow properties characterization
- To evaluate the flow characteristics of the mixed powder, apparent density and tapped density were measured using Hall flowmeter measurements. Hall flowmeter measurements were performed according to ASTM B213 standard specifications. A mass of 50 g of powder was loaded into a funnel with a diameter of 2.5 mm, and the time required for the powder to completely fall was measured. This measurement was repeated three times, and the average value was used as the flow characteristic indicator [28]. The apparent density was calculated based on the volume occupied after filling 100 g of powder into a graduated cylinder. The tapped density was measured using the LABULK 0335 device (HMKTest, China). The measurement conditions were set to 600 seconds and 300 rpm to sufficiently rearrange the powder particles before calculating the density. The Hausner ratio, defined as the ratio of bulk density to tapped density, was used as an indicator to quantitatively evaluate the powder′ s flow characteristics. In general, powders with a Hausner ratio in the range of 1.00–1.11 are classified as exhibiting excellent flowability, whereas powders with a ratio of 1.35 or higher are considered to have poor flowability. Based on these criteria, the powder flowability suitable for application in the L-PBF process was evaluated in this study.
- 2.3 L-PBF process parameter optimization
- In this study, additive manufacturing was performed using the L-PBF process with an L-PBF machine (Any X 120, CSCAM, Republic of Korea). Among the parameters, four key process variables—laser power, scan speed, hatch spacing, and layer thickness—were selected as the primary process variables, as they are known to have the most significant influence on melt track formation and final relative density. Based on these selected parameters, the volumetric energy density (VED), which represents the energy input per unit volume during the L-PBF process, was calculated. VED is defined by the following equation (1).
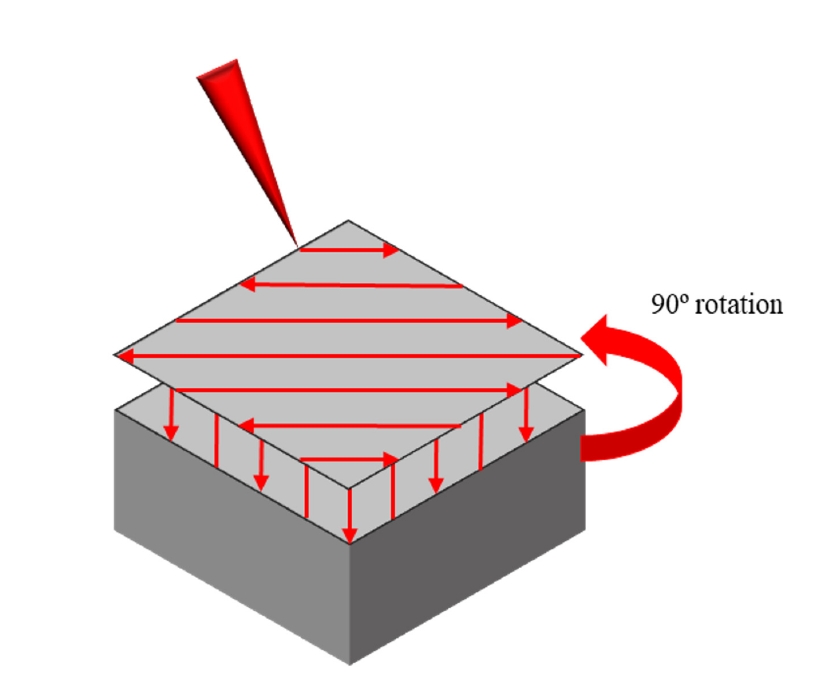
- P denotes the laser power (W), v represents the scan speed (mm/s), h denotes the hatch spacing (mm), and t represents the layer thickness (mm). These four process parameters serve as the primary factors directly influencing melt pool formation, build stability, and suppression of internal defects. In this study, the VED range was established by systematically varying the laser power, scan speed, and hatch spacing while maintaining a constant layer thickness. To identify the optimal VED conditions, a total of 50 specimens were fabricated using a two-step approach, consisting of an initial broad screening followed by a refined investigation within a narrowed VED window. All specimens were fabricated in a cubic geometry with dimensions of 1 cm × 1 cm × 1 cm. The scan strategy for each layer is shown in Fig. 2. Detailed process conditions for each step are summarized and presented in Table 1 and Table 2.
- The relative densities of the 50 specimens fabricated under these conditions were measured using the Archimedes density measurement method. In this study, relative density was employed as the primary criterion for identifying the optimal processing conditions. Based on the process conditions of the highest relative density, tensile specimens were fabricated and microstructures were observed.
- 2.4 Phase & Nitrogen/Oxygen content analysis
- X-ray diffraction (XRD) analysis was conducted to investigate the crystal structure and phase analysis of the mixed powder produced via the dry mixing process and the specimens fabricated using the L-PBF process. XRD analysis was performed using a Bruker D8 ADVANCE instrument. The measurement conditions were set as follows: tube current 40 mA, tube voltage 40 kV, diffraction angle range 2θ = 20–90°, and scan speed 3°/min. In addition, an ONH analyzer (ONH 2000, ELTRA GmbH, Germany) was employed to quantitatively analyze the nitrogen and oxygen contents of the additively manufactured specimens.
- 2.5 Tensile properties
- To evaluate the mechanical properties of the additively manufactured specimens, sub-size tensile specimens with a gauge length of 25 mm, a width of 6 mm, and a thickness of 3 mm were machined from specimens fabricated under the optimal processing conditions in accordance with ASTM E8/E8M-08. Tensile tests were subsequently conducted using a universal testing machine (AG-Retrofit, Shimadzu). The tensile testing conditions were set to a maximum load capacity of 250 kN and a crosshead speed of 500 mm/min, and a total of three specimens were tested for each condition.
- 2.6 Microstructure
- Scanning electron microscopy (SEM; SUPRA 55, ZEISS, Germany) and electron backscatter diffraction (EBSD; Velocity Ultra, EDAX, USA) analyses were conducted to characterize the microstructure of the additively manufactured specimens. Microstructural observations were performed on the XY and XZ planes of the as-built specimens, as well as on specimens after tensile fracture, to investigate grain orientation, microstructural evolution, and deformation mechanisms before and after tensile testing. The magnification for each image was set to 500x, with a step size of 0.45 μm for the EBSD analysis. In addition, to more closely examine the microstructural features in the EBSD data after tensile testing, additional EBSD analyses were conducted at a higher magnification of 1500x with a reduced step size of 0.15 μm. Specimen preparation for EBSD analysis involved stepwise grinding using SiC paper (180–1200 grit) followed by polishing with a 6–1 μm diamond suspension. Finally, to ensure microstructural contrast, etching was performed for approximately 10 seconds using Kroll′ s reagent (HF 40%: 2 ml, HNO₃ 65%: 6 ml, distilled water: 92 ml).
2. Materials and methods
- 3.1 Powder preparation & flowability
- Fig. 3 (a) shows the flowability results of powders mixed with non-spherical and spherical powders at various mixing ratios. When the non-spherical powder content exceeded 20 wt.%, flowability measurement using the Hall flowmeter became impossible. This behavior is attributed to the irregular morphology of the non-spherical particles, which increases interparticle friction and agglomeration, causing a sharp decrease in flowability.
- In contrast, Fig. 3(b) shows the flowability results obtained after adding 0.1 wt.% SiO2 to the mixed powders. When SiO2 was added, flowability using the Hall flowmeter was possible for all mixed powders, regardless of the non-spherical powder content. This result indicates that the addition of a small amount of SiO2 significantly enhanced powder flowability by effectively reducing particle-to-particle friction and agglomeration caused by moisture through hydrophobic surface modification of the powder.
- Subsequently, the variation in flowability with mixing ratio was analyzed to determine an appropriate mixing ratio for subsequent experiments. The results showed that the composition of 60 wt.% non-spherical powder and 40 wt.% spherical powder exhibited the steepest slope in flow characteristics. This composition was therefore identified as the optimal mixing ratio, as it maximizes the economic benefit of non-spherical powder utilization while maintaining flowability suitable for the L-PBF process. Accordingly, this composition was selected as the representative mixed powder for this study. Hereafter, the term “mixed powder” refers to a powder mixed with a non-spherical-to-spherical powder ratio of 6:4 and containing 0.1 wt.% SiO2.
- Table 3 shows the results of measuring the apparent density, tap density, and Hausner ratio of a powder manufactured by mixing non-spherical powder and spherical powder in a 6:4 ratio.
- For irregularly shaped titanium powder, the apparent density and tapped density were approximately 1.75 times and 1.41 times lower, respectively, compared to spherical titanium powder. This indicates that non-spherical powder, characterized by irregular morphology and rough surface features, forms relatively larger interparticle space. Consequently, under identical tapping time and conditions, particle rearrangement and densification are more difficult for non-spherical powder than for spherical powder. For the mixed powder, the apparent density and tapped density were measured to be 2.04 ± 0.02 g/cm3 and 2.31 ± 0.04 g/cm3, respectively, showing no significant deviation from those of the spherical powder. The Hausner ratio showed very good flowability for spherical powder at approximately 1.08, while the mixed powder exhibited a somewhat higher value of 1.13 compared to spherical powder. In this study, to derive a reasonable mixing ratio, the proportion of non-spherical powder was set higher than that of spherical powder. As a result, the outstanding flowability observed for spherical powder alone was not fully attained.
- Nevertheless, the Hausner ratio of the mixed powder showed an improvement of approximately 1.17 times compared to the non-spherical powder, approaching the reference value of 1.11, which is commonly regarded as indicative of excellent flowability. Therefore, the 6:4 mixed powder proposed in this study is considered to possess powder flow characteristics suitable for practical application in additive manufacturing processes.
- Figure 4 shows the SEM and EDS analysis results confirming the uniform dispersion of SiO2 on the surface of the mixed powder. The EDS elemental mapping analysis revealed that the Si was homogeneously distributed over the entire powder surface, indicating that SiO2 nanoparticles were uniformly dispersed on the powder particles through the dry-mixing process.
- Additionally, N/O analysis was performed to evaluate the oxygen concentration of the SiO2 coated mixed powder, and the results are shown in Table 4. The oxygen contents of the non-spherical titanium powder and spherical titanium powder were measured to be 4,183.2 ppm and 828.1 ppm, respectively. When mixing non-spherical and spherical powders at a 6:4 ratio, the theoretical oxygen concentration calculated using the rule of mixtures is 2,841.2 ppm.
- However, the actual oxygen content measured by N/O analysis was 3,132.6 ppm, which is higher than the theoretical value. This difference is attributed to an increase in oxygen content resulting from exposure to atmospheric oxygen during the physical mixing process and the subsequent sample preparation procedures required for analysis.
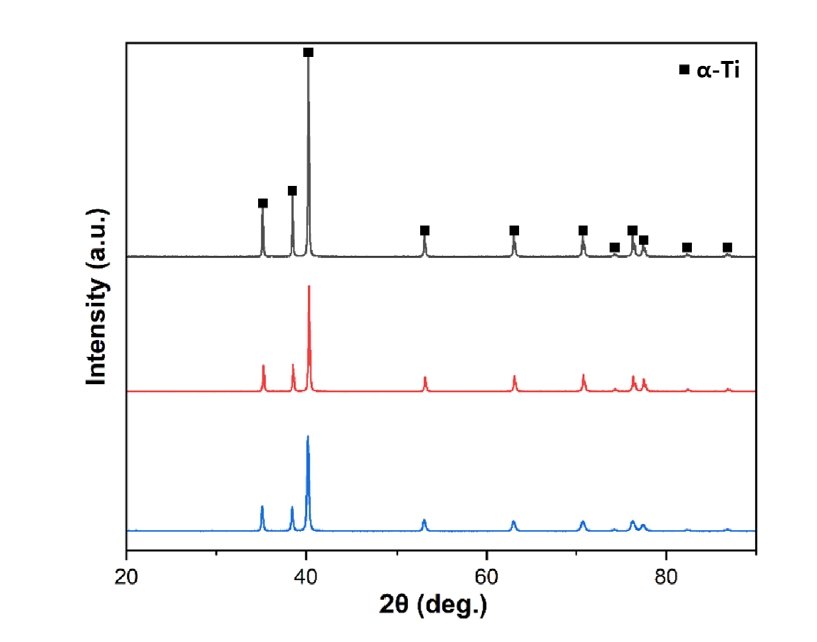
- Figure 5 presents the XRD analysis results of the spherical titanium powder, the non-spherical–spherical mixed powder, and the SiO2-coated mixed powder used in this study. In all powder conditions, only diffraction peaks corresponding to the α/α′-Ti phase were observed. No peak shifts or formation of new phases due to SiO2 addition were detected. These results indicate that titanium remains stably in the α phase at room temperature. Furthermore, since the amount of SiO2 added in this study was only 0.1 wt.%, a very small amount, no detectable phase transformation was observed in the XRD analysis.
- 3.2 Relative density
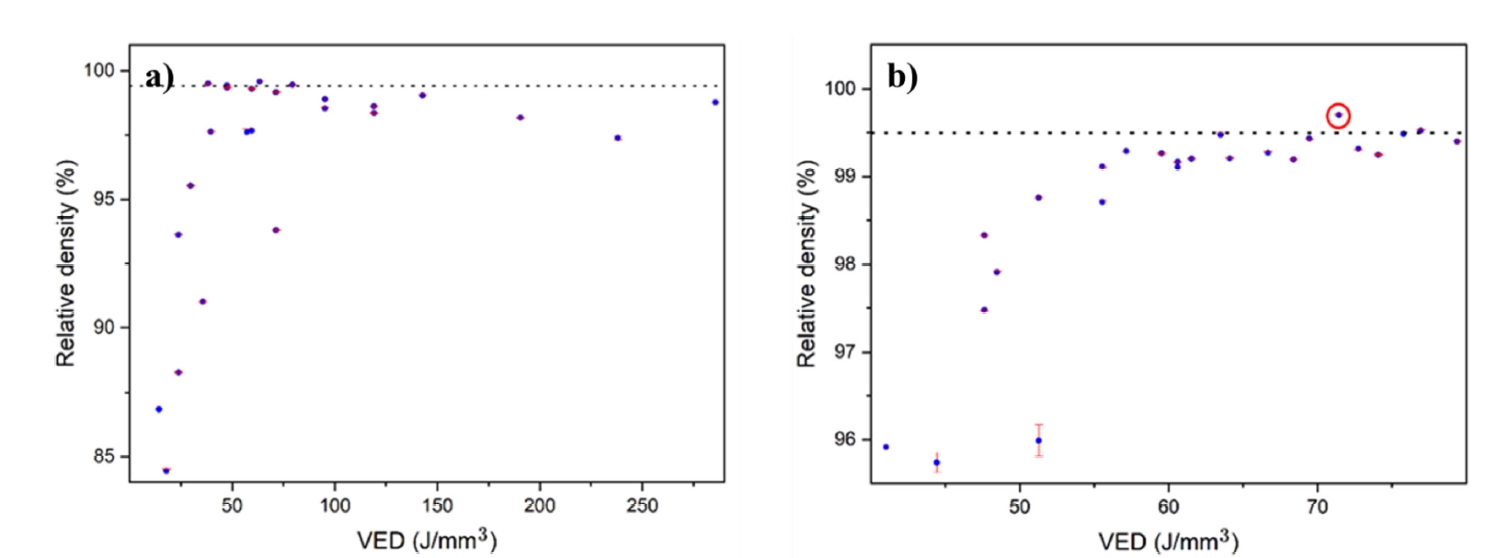
- The results of the relative density results of a total of 50 specimens fabricated via the additive manufacturing process are shown in Fig. 6. In the primary process, L-PBF process was conducted over a wide range of VED to broadly investigate the processing window. As a result, the lowest relative density was confirmed to be approximately 84.4%. This low density is attributed to insufficient powder melting under conditions of low laser power and high scan speed, which promoted the formation of a large number of lack-of-fusion (LOF) defects and internal voids within the specimens.
- Specimens exhibiting a relative density of 99% or higher were obtained only within a VED range of 38.1 J/mm³ to 142.9 J/mm³. Within this range, the highest relative density of approximately 99.6% was achieved at a VED of 63.5 J/mm³. Based on these results, an effective VED window enabling stable, high-density fabrication was identified for the mixed powder system employed in this study.
- In the secondary process, L-PBF process was performed by setting hatch spacing as an additional process variable within the effective VED range derived from the primary process. As a result, all fabricated specimens achieved relative densities exceeding 95%, with the maximum relative density reaching approximately 99.7% at a VED of 71.4 J/mm³. This improvement in relative density is attributed to the enhanced powder flowability resulting from SiO2 addition, which increased powder packing density on the powder bed and simultaneously improved laser absorption efficiency, thereby enhancing overall process stability [29, 30].
- To verify the presence of Si within the specimen fabricated under the process conditions achieving the highest relative density (laser power: 120 W, scan speed: 400 mm/s, hatch spacing: 0.14 mm, layer thickness: 0.03 mm), SEM & EDS mapping images of the cubic sample are presented in Fig. 7. The results confirm that Si is uniformly distributed throughout the Ti matrix. This provides crucial evidence for interpreting the influence of Si presence within the matrix on the variations in mechanical strength, as discussed in the subsequent tensile test results. The mechanical properties reported thereafter were evaluated using cubic specimens fabricated under the same processing conditions as those shown in Fig. 7.
- 3.3 Tensile test
- Figure 8 and Table 5 present the tensile test results of specimens prepared in accordance with ASTM E8/E8M-08. The tensile tests were conducted on specimens fabricated under the previously identified optimal processing conditions that achieved the highest relative density The ultimate tensile strength (UTS), yield strength (YS), and elongation (%) of the additively manufactured specimen produced using the mixed powder were measured to be 762.6 ± 3.8 MPa, 664.2 ± 4.9 MPa, and 22.1 ± 0.7%, respectively. These mechanical properties not only satisfy the requirements of ASTM Grade 4 commercially pure titanium but also significantly exceed those of ASTM Grade 3.
- This enhancement in strength is attributed to the added SiO2 remaining within the matrix and being dispersed primarily around grain boundaries, effectively restricting dislocation movement and inducing microstructural rearrangement, thereby enhancing mechanical strength [31]. Notably, the simultaneous attainment of both strength and elongation despite the addition of a small amount of oxide nanoparticles indicates that the oxygen concentration in the mixed powder was appropriately controlled.
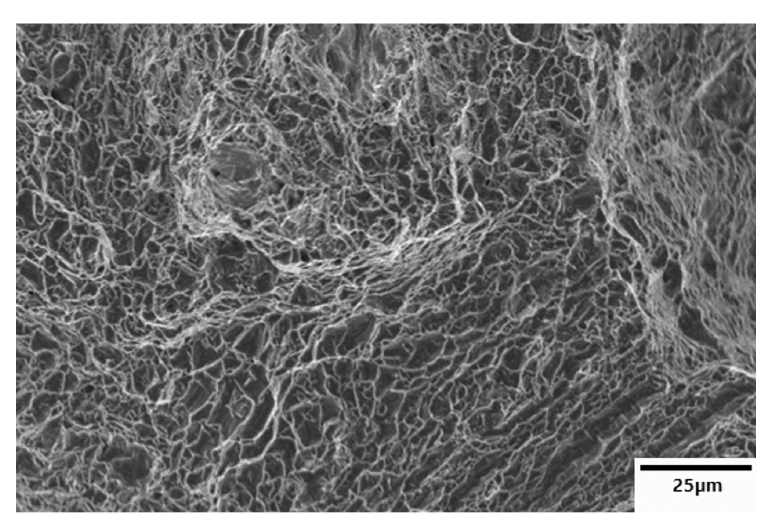
- Figure 9 presents the SEM image of the fracture surface. The SEM images reveal a widespread distribution of dimpled morphology, which is a characteristic feature of ductile fracture. This observation is consistent with, and strongly supports, the high elongation measured for the corresponding specimens.
- 3.4 Microstructure (EBSD analysis)
- The high elongation values obtained in this study exhibit a trend comparable to those reported in previous studies on Ti–O based alloys. To analyze the origin of this high elongation more precisely, additional XY-plane EBSD analysis of the specimens before and after tensile testing and XZ-direction EBSD of the L-PBF specimens were performed. Figure 10 presents the EBSD results obtained before and after tensile testing for specimens L-PBF using the mixed powder. Fig. 10(a) shows the pre-tensile SEM image and Fig. 10(a-1) shows the EBSD results observed along the build direction (BD), revealing a randomly oriented acicular α′-martensitic microstructure, which is commonly observed in α-titanium based alloys. The α′-martensite is a microstructure formed under rapid solidification conditions, known to provide high mechanical strength. This microstructural feature is consistent with the high tensile strength exhibited by the specimens fabricated using the mixed powder in this study.
- Meanwhile, in the local region marked by a red circle in Fig. 10(a), a relatively coarse microstructure distinct from the acicular martensitic morphology is observed. This microstructure is identified as a massive α′ phase, which reported in α-titanium alloys and is presumed to have formed due to local variations in cooling rate during the additive manufacturing process. Park et al. confirmed that massive transformation occurs in pure Ti and pure Ti-O systems, and that the massive α′ phase transforms into acicular α′ martensite (> 10 K/s) and α′m massive phase (> 350 K/s) when rapidly cooled above the β transus temperature [32].
- According to the Hall–Petch relationship, materials composed of finer grains generally exhibit higher strength. Although massive phases can partially act as microstructures that reduce mechanical strength, Lu et al. demonstrated high strength and elongation in Ti-based alloys exhibiting massive phases. Based on the microstructures observed in this study, the massive α′ phase appears only locally within a matrix predominantly composed of acicular martensite. This suggests that the massive phase has a limited influence on strength and instead contributes to enhanced ductility [33].
-
Figure 10(b) and 10(b-1) respectively present the SEM image and IQ + IPF map of the region near the fracture surface after tensile testing and while Fig. 10(b-3) presents the IQ + IPF map viewed along the transverse direction (TD). After the tensile test, a microstructure elongated locally parallel to the tensile direction is observed. These features correspond to grains elongated along the <
- The IQ+IPF map and pole figure analysis in the XZ direction for the additive manufacturing sample before and after tensile deformation is shown in Fig. 11. As shown in Fig. 11(a), the microstructure consists of acicular α′ martensite and locally distributed massive α′ phases formed within grains parallel to the build direction (BD). This microstructural feature indicates that the α′ phase was preferentially formed as a result of the extremely high cooling rates and repetitive thermal cycles inherent to the L-PBF process. In contrast, after tensile deformation, Fig. 11(b) reveals a pronounced elongation of the microstructure along the <
- The pole figure maps shown in Fig. 11(a-1) and (b-1) confirm the development of a very strong {0001} texture along the BD direction, consistent with the results presented in Fig. 10(a-2) and (b-2). This texture development is attributed to variant selection occurring during the β → α phase transformation in titanium alloys fabricated by the L-PBF process. From a single prior β grain, the α phase can theoretically form 12 different crystallographic orientations (variants). However, during the actual β → α/α′ transformation, these variants do not form with equal probability; instead, a variant selection mechanism occurs where specific variants are preferentially formed. As a result, only certain α′ crystallographic orientations are inherited from the parent β grain, manifesting as the appearance of locally enhanced specific crystallographic orientations in the pole figure [35]. The {0001} texture aligned with the BD direction was confirmed to grow parallel to the BD direction, following the {0001}α||{110}β relationship in accordance with the Burgers orientation relationship [36-38].
- Traditionally, α-phase HCP titanium alloys exhibit limited slip systems, and plastic deformation is often accommodated by deformation twinning. Consequently, twins with the 87º<11
- Unlike conventional pure titanium alloys, the absence of deformation twinning in specimens fabricated via additive manufacturing using the mixed powder is attributed to the increased oxygen content within the alloy. High oxygen concentration is known to increase the energy barrier for twinning formation by raising the stacking fault energy of α-titanium with an HCP crystal structure, thereby effectively suppressing deformation twinning [42]. Instead, oxygen promotes the formation of α′ martensite and the massive α′ phase. It also induces micro-recrystallization of α′ clusters generated during the L-PBF process. As a result, plastic deformation is accommodated predominantly through alternative mechanisms, such as plastic deformation via dislocation slip and grain rotation, rather than twinning [43]. Consistent with this behavior, W. Shi et al. reported observing a new deformation mode in oxygen-added titanium alloys, where dislocation-based deformation and microstructural rearrangement significantly contributed to elongation improvement, rather than deformation twinning [44].
- Nevertheless, high-magnification EBSD analysis conducted after tensile deformation (Fig. 11(b)) reveals the presence of localized twins within certain grains. This observation is consistent with previously reported deformation behaviors of Ti–O alloys. For example, S. Kariya et al. confirmed the occurrence of deformation twinning after tensile testing in Ti–O alloys containing approximately 6700 ppm oxygen, and attributed this behavior to the deformation mechanisms of the α′-Ti phase. In titanium alloys, while the deformation system of α-Ti is primarily governed by prismatic and pyramidal slip, α′-Ti is known to deform through a combination of basal slip, pyramidal II ⟨c+a⟩ slip, and deformation twinning [45]. Similarly, Matsumoto et al. reported that α′-Ti exhibits deformation twinning in conjunction with basal slip during tensile deformation [46].
- Therefore, conventional deformation twinning was largely suppressed by the presence of oxygen, while grain rotation and slip-dominated deformation mechanisms played a dominant role in achieving excellent elongation. The locally observed twins after tensile deformation are interpreted as being partially activated due to deformation mechanisms intrinsic to the α′-Ti phase. Furthermore, previous studies by G. Choi et al. demonstrated that YSZ oxides can decompose and dissolve into the matrix, forming strongly bonded Y-rich clusters at contribute to strengthening. It is anticipated that the SiO2 in this study similarly decomposed and dissolved into the titanium matrix, contributing to the high strength obtained [47].
3. Results and Discussion
- In this study, to simultaneously achieve powder flow properties suitable for the L-PBF process and excellent mechanical properties while maintaining the cost-effectiveness of non-spherical titanium powder, non-spherical powder and spherical powder were mixed at a 6:4 ratio, and 0.1 wt.% SiO2 nanoparticles were uniformly dispersed. The conclusions drawn from this study are as follows.
- 1) When the content of non-spherical powder exceeded 20 wt.%, flowability measurement using a Hall flowmeter was impossible. However, when 0.1 wt.% SiO2 was added, Hall flowmeter measurements became possible for all powder mixtures regardless of the non-spherical powder content. This improvement is attributed to the hydrophobic surface modification induced by SiO2 nanoparticles, which effectively reduced interparticle friction and enhanced powder flowability. Measurements based on mixing ratios showed the largest slope difference at a non-spherical:spherical ratio of 6:4, which was selected as the optimal mixing ratio simultaneously balancing economic efficiency and process applicability.
- 2) SEM and EDS analysis of the powders confirmed that SiO2 nanoparticles were uniformly attached to both non-spherical and spherical titanium powders. Furthermore, XRD analysis showed no new peaks or shifts due to SiO2 addition, indicating the extremely low SiO2 content of 0.1 wt.%.
- 3) The primary process established an effective VED window of 38.1–142.9 J/mm³ for the mixed powder system. In the secondary process, setting hatch spacing as an additional variable achieved a maximum relative density of approximately 99.7%. This enhancement is attributed to the combined effects of improved powder flowability due to SiO2 addition, increased powder bed packing density, and enhanced laser absorption efficiency.
- 4) Specimens fabricated using the optimized powder mixing ratio and processing conditions exhibited an ultimate tensile strength of 762.6 ± 3.8 MPa, a yield strength of 664.2 ± 4.9 MPa, and an elongation of 22.1 ± 0.7%, confirming results exceeding ASTM Grade 4 and Grade 3. This performance is attributed to the appropriate control of oxygen concentration in the mixed powder and the resulting additively manufactured specimens, enabling the simultaneous achievement of high strength and ductility.
- 5) The fabricated specimens exhibited a microstructure predominantly composed of acicular α′ martensite, with locally distributed massive α′ phases. EBSD analysis revealed the formation of a strong {0001} texture along the BD direction, which can be explained by variant selection governed by the Burgers orientation relationship during the β → α/α′ phase transformation. Furthermore, deformation twinning was suppressed in the Ti–O alloy specimens due to the increased oxygen content. As a result, plastic deformation was dominated by dislocation slip and grain rotation mechanisms, leading to the observed high elongation.
- Overall, this study experimentally demonstrated that the addition of a small amount of SiO2 nanoparticles to low-cost non-spherical titanium powder can simultaneously enhance powder flowability, process stability, and mechanical performance. The proposed mixed powder strategy is expected to provide an effective approach for designing pure titanium and Ti-O alloys, enabling the simultaneous achievement of cost-effectiveness and high performance.
4. Conclusion
-
Funding
This work was supported by the National Research Foundation of Korea (NRF) grant funded by the Korean government (Grant No. RS-2023-00212081) and by Korea Institute of Energy Technology Evaluation and Planning (KETEP) grant funded by the Korean government (MOTIE)(RS-2024-00349003, “Support for on-site practical training linked to public enterprises”).
-
Conflict of Interest
The authors have no conflicts of interest to declare.
-
Data Availability Statement
Data will be made available on request.
-
Author Information and Contribution
Taehu Kang: MSc student; Conceptualization of the study, original manuscript drafting.
Ukju Gim: MSc student; Powder preparation and L-PBF process trials; hydrophobic SiO2 nanoparticle coating.
Sehun Kim: MSc student; Microstructural characterization by SEM and EBSD, Review & Editing.
Jongik Lee: MSc student, 3D modelling assist, Review & Editing.
Sanghee Jeong: MSc student; Review & Editing.
Jimin Han: Undergraduate student; Review & Editing.
Bin Lee: Associate professor; Project supervision and funding acquisition, overall study conceptualization, critical review and editing of the manuscript; correspondence with the journal.
-
Acknowledgments
None.
Article information


| HDH Ti | Spherical Ti | HDH Ti + Spherical Ti + SiO2 0.1 wt.% | |
|---|---|---|---|
| Apparent Density (g/cm3) | 1.42±0.04 | 2.48±0.02 | 2.04±0.02 |
| Tap Density (g/cm3) | 1.89±0.02 | 2.66±0.02 | 2.31±0.04 |
| Hausner Ratio | 1.33 | 1.08 | 1.14 |
| Powder | O2(ppm) | N2(ppm) |
|---|---|---|
| HDH Ti | 4,183.2 | 263.9 |
| Spherical Ti | 828.1 | 214.4 |
| HDH Ti + Spherical Ti + SiO2 | 3,132.6 | 323.1 |
| Sample | UTS (MPa) | YS (MPa) | Elongation (%) |
|---|---|---|---|
| ASTM grade 3 | 480 ~ 620 | 345 min | 18 min |
| ASTM grade 4 | 550 ~ 750 | 485 min | 15 min |
| L-PBF sample | 762.6±3.8 | 664.2±4.9 | 22.1±0.7 |
- 1. M. Armstrong, H. Mehrabi and N. Naveed: J. Manuf. Process., 84 (2022) 1001.Article
- 2. B. Blakey-Milner, P. Gradl, G. Snedden, M. Brooks, J. Pitot, E. Lopez, M. Leary, F. Berto and A. du Plessis: Mater. Des., 209 (2021) 110008.Article
- 3. S. A. M. Tofail, E. P. Koumoulos, A. Bandyopadhyay, S. Bose, L. O’Donoghue and C. Charitidis: Mater. Today, 21 (2018) 22.Article
- 4. B. Lee, D.-K. Kim, Y. Il Kim, D. H. Kim, Y. Son, K.-T. Park and T.-S. Kim: J. Korean Powder Metall. Inst., 27 (2020) 509.Article
- 5. Y. Wang, Y. Chen, C. Wen, K. Huang, Z. Chen, B. Han and Q. Zhang: Mater. Des., 227 (2023) 111732.Article
- 6. L. Y. Chen, J. C. Huang, C. H. Lin, C. T. Pan, S. Y. Chen, T. L. Yang, D. Y. Lin, H. K. Lin and J. S. C. Jang: Mater. Sci. Eng., A, 682 (2017) 389.Article
- 7. B. Dutta and F. H. Froes: Metal Powder Report, 72 (2017) 96.Article
- 8. Z. Zhang, X. Yang, F. Song, X. Yao, T. Zhang, S. Liu and H. Tang: Mater. Charact., 194 (2022) 112481.Article
- 9. S. Liu and Y. C. Shin: Mater. Des., 164 (2019) 107552.Article
- 10. S. Kim, U. Gim, T. Kang, J. Lee, S. Jeong, J. Han and B. Lee: J. Powder Mater., 32 (2025) 288.ArticlePDF
- 11. ASTM F2924:14, Specification for Additive Manufacturing Titanium-6 Aluminum-4 Vanadium with Powder Bed Fusion.
- 12. Y. B. Zhang, G. J. Zhang, T. Li, Z. M. Liu, B. J. Zhang, L. Qu, R. Q. Zhang and S. W. Xin: Mater. Sci. Eng., A, 895 (2024) 146235.Article
- 13. I. Weiss and S. L. Semiatin: Mat. Sci. Eng. A, 263 (1999) 243.
- 14. ASTM B0265:20, Specification for Titanium and Titanium Alloy Strip, Sheet, and Plate.
- 15. Z. Zhang, X. Yang, C. Song, S. Xu, M. Huang, C. Ding, H. Qi, S. Li and H. Tang: Mater. Today Commun., 45 (2025) 112399.Article
- 16. W. Xu, S. Xiao, X. Lu, G. Chen, C. Liu and X. Qu: J. Mater. Sci. Technol., 35 (2019) 322.Article
- 17. Y. I. Kim, D. K. Kim, I. Y. Kim, S. C. Park, D. Lee and B. Lee: Mater. Des., 223 (2022) 111247.Article
- 18. Y. H. Hou, B. Liu, Y. Liu, Y. H. Zhou, T. T. Song, Q. Zhou, G. Sha and M. Yan: Opto-Electron. Adv., 2 (2019) 180028-1.
- 19. J. S. Choe, D. H. Lee, G. S. Choi, D. S. Kil, C. Y. Suh, W. Kim and H. Ha: Korean J. Mater. Res., 10 (2000) 464.
- 20. N. Emminghaus, R. Bernhard, J. Hermsdorf and S. Kaierle: Int. J. Adv. Manuf. Technol., 122 (2022) 1679.ArticlePDF
- 21. V. D. Khavryuchenko, O. V. Khavryuchenko and V. V. Lisnyak: Crit. Rev. Solid State Mater. Sci., 36 (2011) 47.Article
- 22. E. Gärtner, H. Y. Jung, N. J. Peter, G. Dehm, E. A. Jägle, V. Uhlenwinkel and L. Mädler: Powder Technol., 379 (2021) 585.Article
- 23. U. Gim, S. Kim, T. hu Kang, J. Lee, S. Jeong, J. Han and B. Lee: Powder Metall., 68 (2025) 95.ArticlePDF
- 24. F. Amann, R. Poulain, S. Delannoy, J. P. Couzinié, E. Clouet, I. Guillot and F. Prima: Mater. Sci. Eng., A, 867 (2023) 144720.Article
- 25. S. D. Luo, T. Song, S. L. Lu, B. Liu, J. Tian and M. Qian: J. Alloys Compd., 836 (2020) 155526.Article
- 26. W. Ding, Q. Tao, J. Chen, G. Chen, X. Qu and M. Qin: J. Mater. Process. Technol., 313 (2023) 117887.Article
- 27. J. Lee, T. Kang, U. Gim, S. Kim, S. Jung, J. Han and B. Lee: Powder Metall., 68 (2025) 333.ArticlePDF
- 28. ASTM B0213:20, Test Methods for Flow Rate of Metal Powders Using the Hall Flowmeter Funnel.
- 29. B. Brandau, A. Da Silva, C. Wilsnack, F. Brueckner and A. F. H. Kaplan: Mater. Des., 216 (2022) 110591.Article
- 30. M. B. Wilms, S. K. Rittinghaus, M. Goßling and B. Gökce: Prog. Mater. Sci., 133 (2023) 101049.Article
- 31. Z. Zhang and D. L. Chen: Mater. Sci. Eng., A, 148 (2008) 483.Article
- 32. S. K. Kim and J. K. Park: Metall. Trans. A, 33 (2002) 1051.ArticlePDF
- 33. S. L. Lu, D. Han, D. Y. Qin, T. Song, D. Qiu, M. Brandt, H. P. Tang and M. Qian: Scr. Mater., 239 (2024) 115776.Article
- 34. W. Li, S. Yamasaki, M. Mitsuhara and H. Nakashima: Mater. Charact., 163 (2020) 110282.Article
- 35. Q. Gaillard, S. Cazottes, X. Boulnat, S. Dancette and C. Desrayaud: Procedia CIRP, 108 (2022) 698.Article
- 36. L. Zhou, H. Liu, C. Yan, Y. Wei, Z. Xia, H. Peng and J. Tang: Met. Mater. Int., 30 (2024) 1864.ArticlePDF
- 37. T. Mayer, F. Friso and R. Radis: Metall. Mater. Trans. A, 56 (2025) 1287.ArticlePDF
- 38. S. Lu, A. E. Medvedev, D. Qiu, T. Song, M. Brandt and M. Qian: Scr. Mater., 263 (2025) 116690.Article
- 39. Y. Zhu, K. Zhang, Z. Meng, K. Zhang, P. Hodgson, N. Birbilis, M. Weyland, H. L. Fraser, S. C. V. Lim, H. Peng, R. Yang, H. Wang and A. Huang: Nat. Mater., 21 (2022) 1258.ArticlePDF
- 40. Q. Wang, K. Zhang, D. Qiu and W. Niu: Mater. Charact., 176 (2021) 111074.Article
- 41. K. Li, J. Yang, Y. Yi, X. Liu, Y. Liu, L. C. Zhang, W. Zhang, W. Li, D. Chen and S. Zhou: Acta Mater., 256 (2023) 119112.Article
- 42. M. Ghazisaeidi and D. R. Trinkle: Acta Mater., 76 (2014) 82.Article
- 43. A. Otsu, A. Doi, T. Onda, T. Kimura, T. Nakamoto and Z. C. Chen: Addit. Manuf., 85 (2024) 104170.Article
- 44. W. Shi, J. Shen, S. Lu, B. Chen, M. Atif and Y. Li: Mater. Sci. Eng., A, 862 (2023) 144429.Article
- 45. S. Kariya, A. Issariyapat, A. Bahador, J. Umeda, J. Shen, K. Yamanaka, A. Chiba and K. Kondoh: Mater. Sci. Eng., A, 892 (2024) 146057.Article
- 46. H. Matsumoto, H. Yoneda, D. Fabregue, E. Maire, A. Chiba and F. Gejima: J. Alloys Compd., 509 (2011) 2684.Article
- 47. G. Choi, W. S. Choi, Y. S. Lee, D. Kim, J. H. Sung, S. An, C. S. Oh, A. Hattal, M. Djemai, B. Bacroix, G. Dirras and P. P. Choi: J. Mater. Sci. Technol., 112 (2022) 138.Article
References
Figure & Data
References
Citations
 ePub Link
 Cite this Article
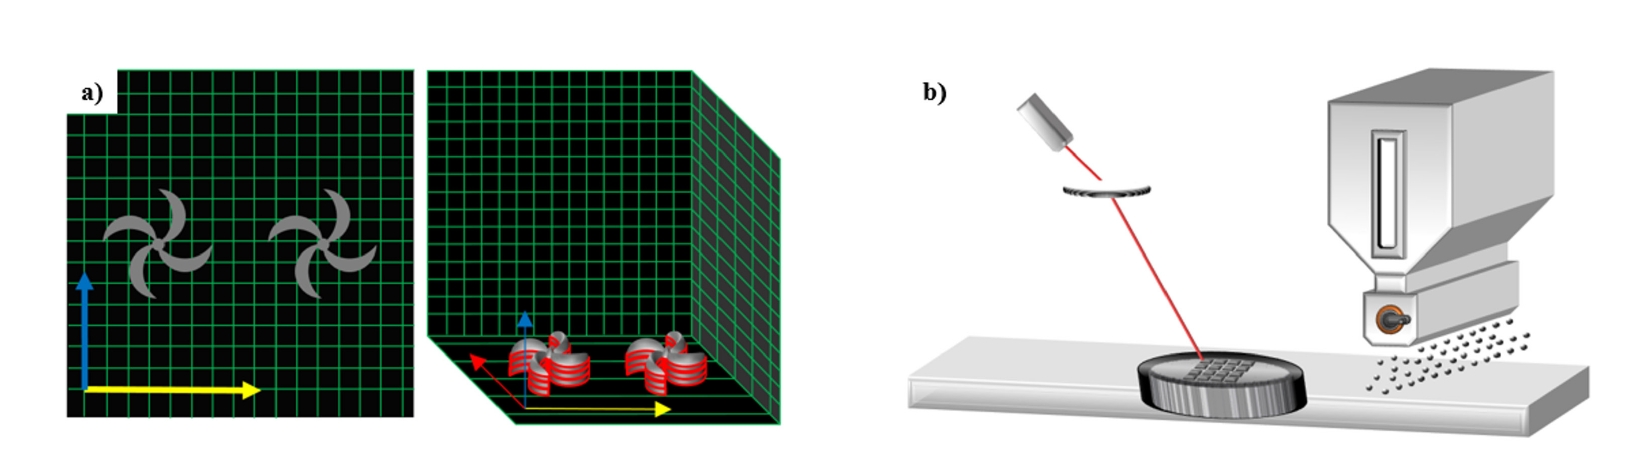


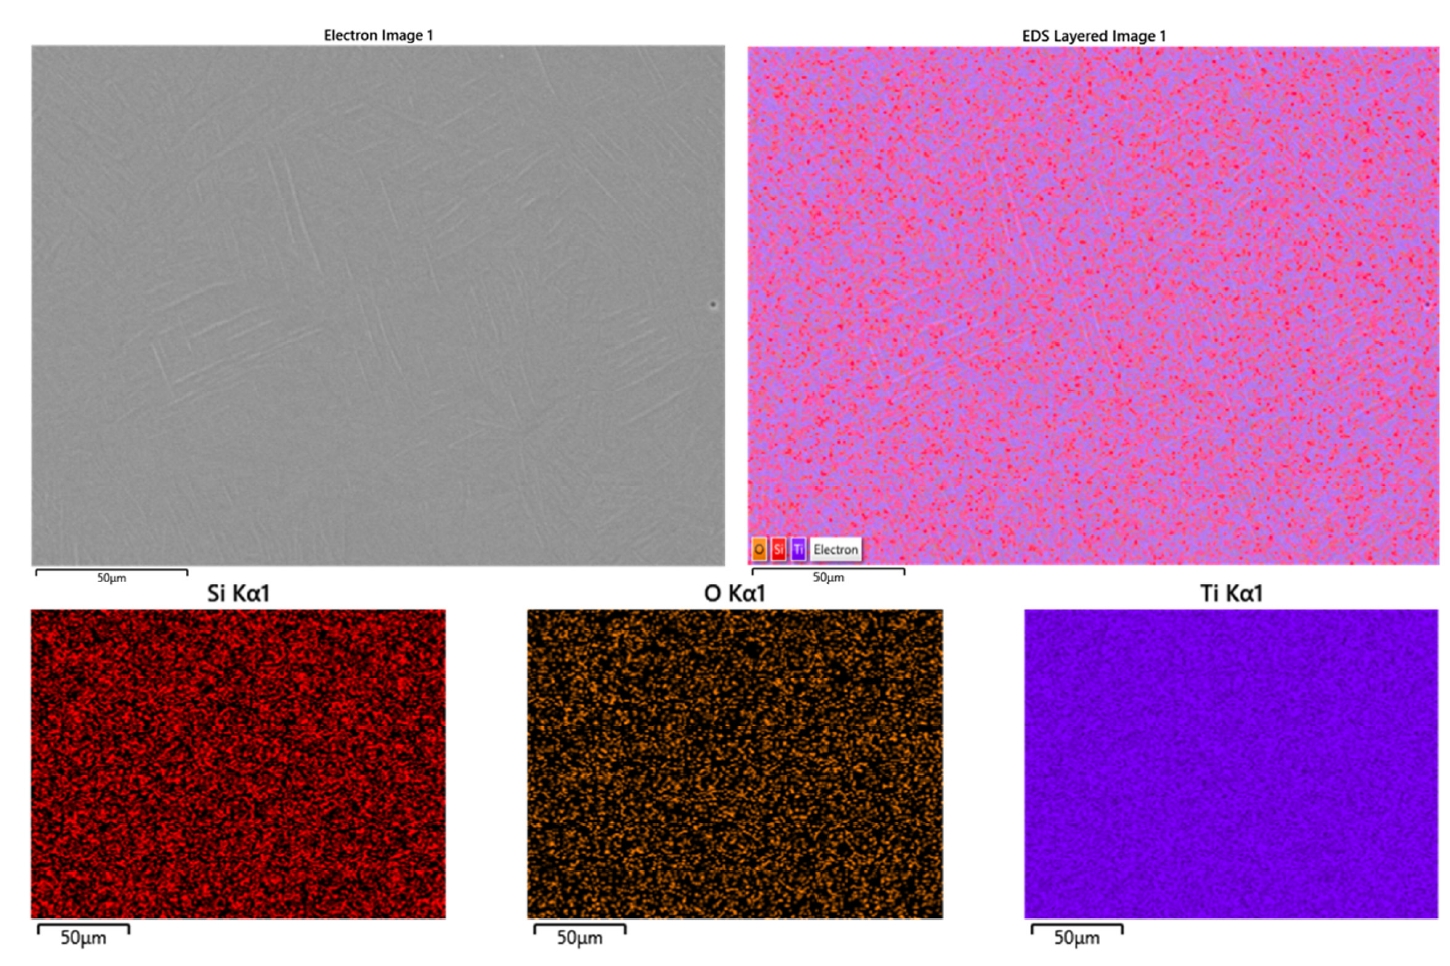
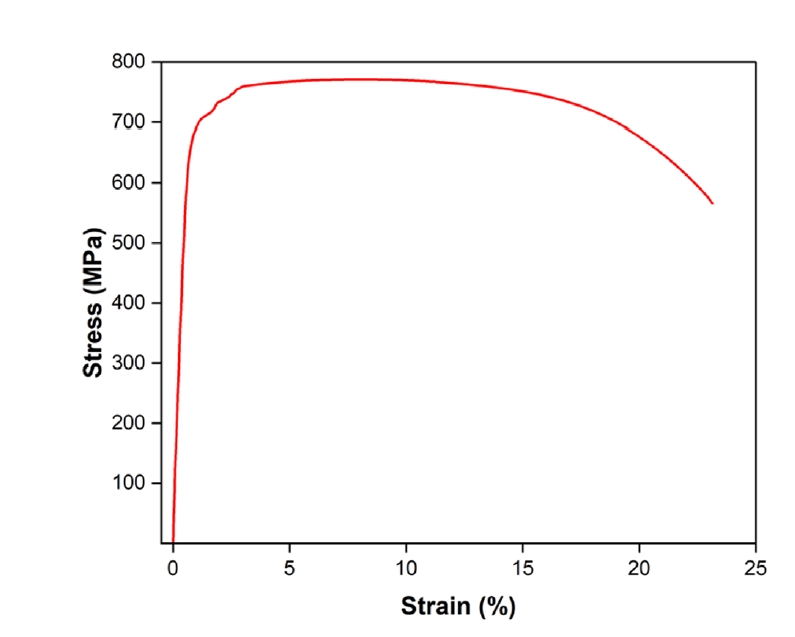


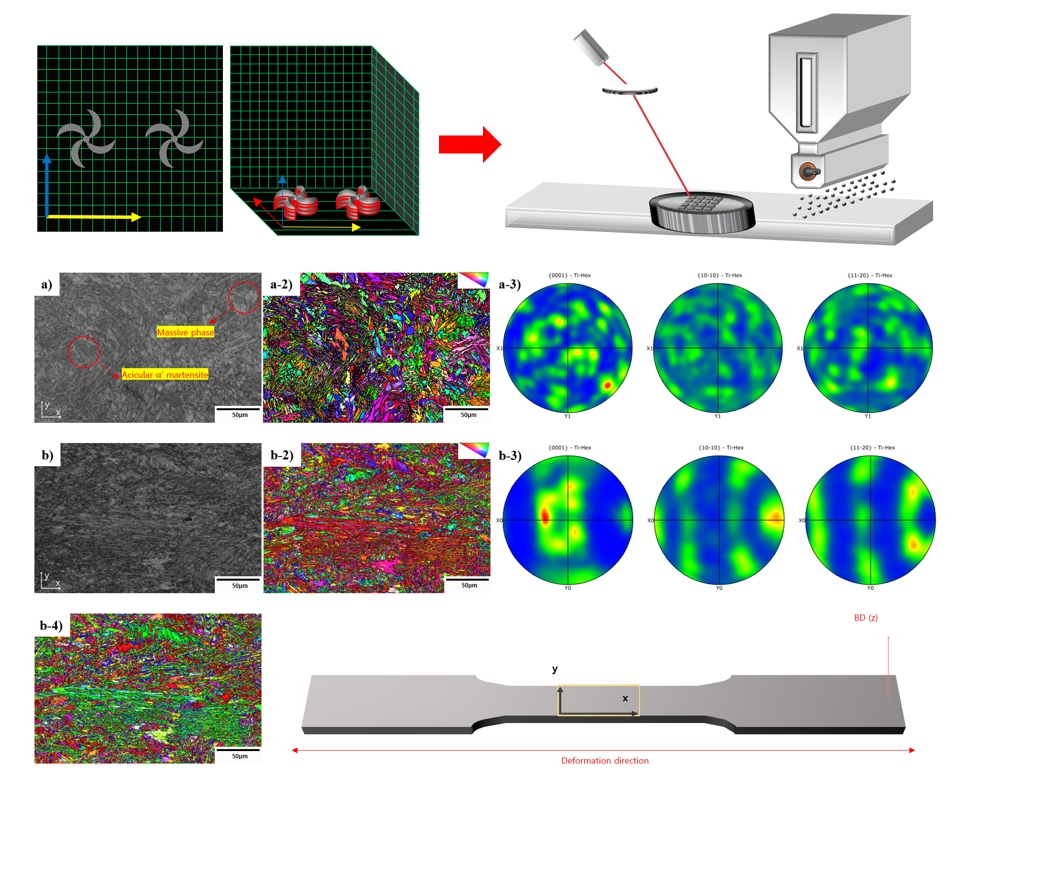


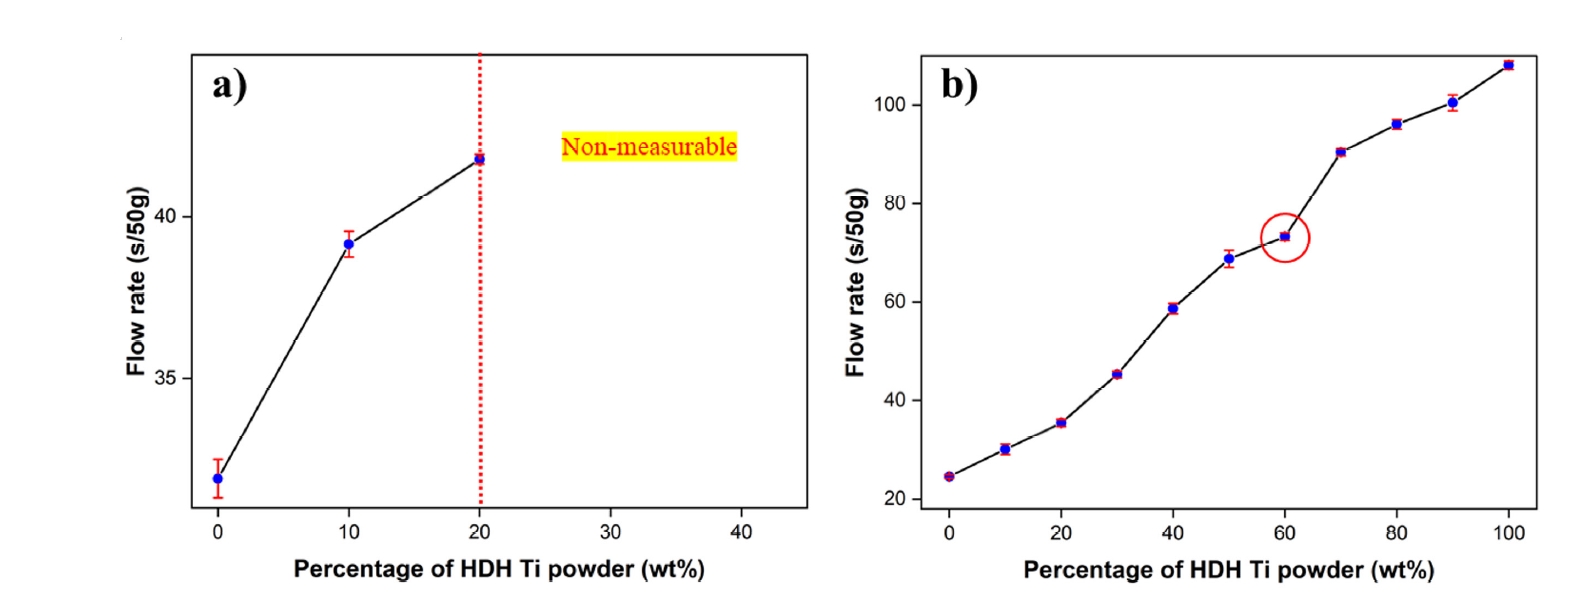
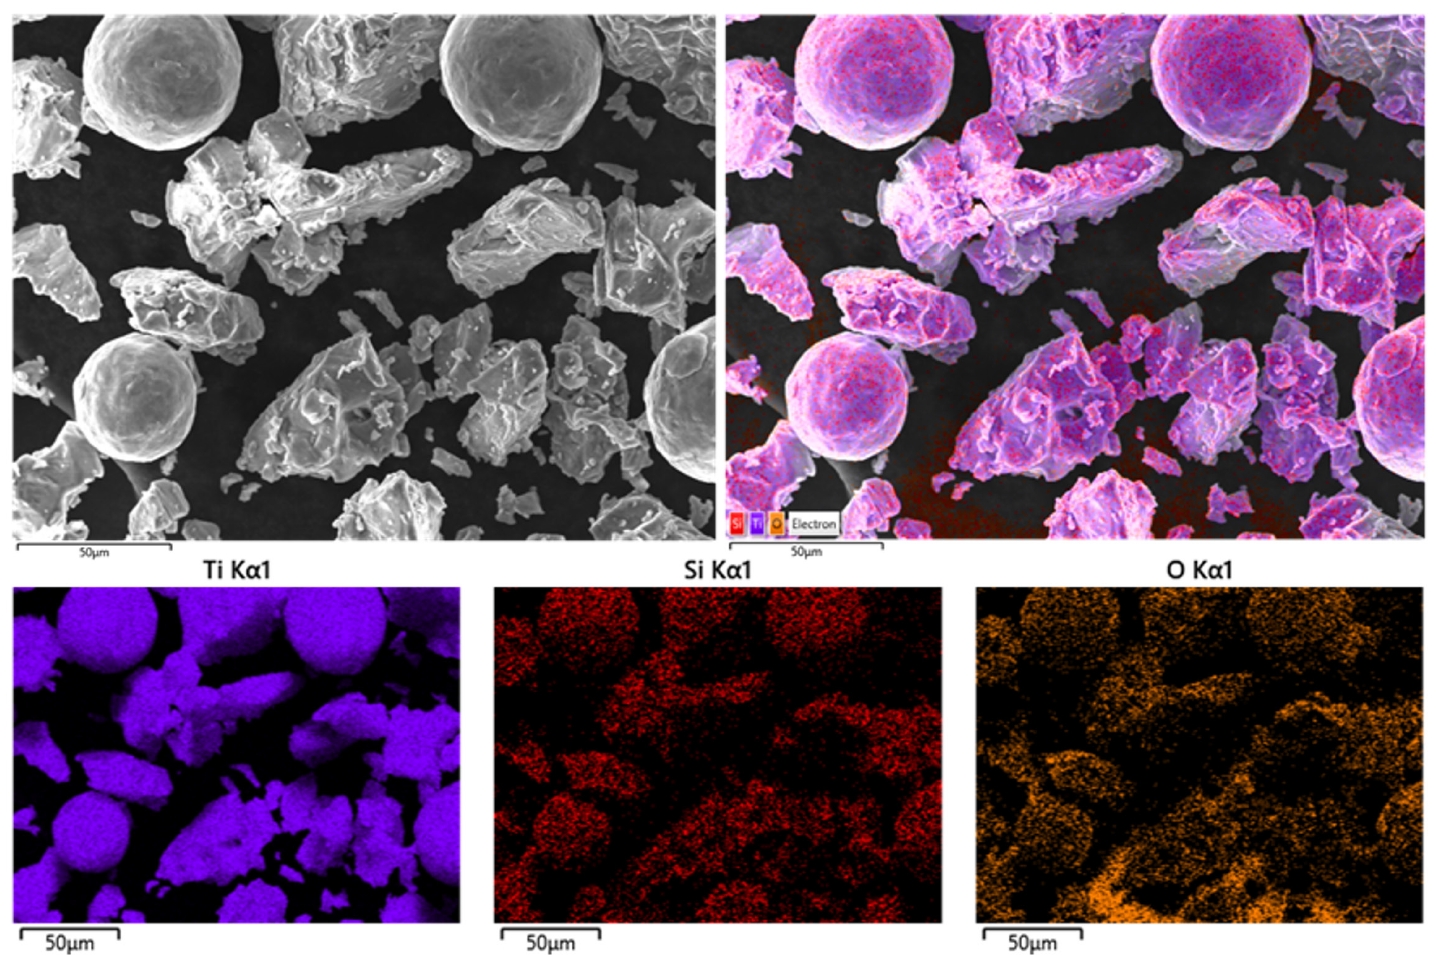


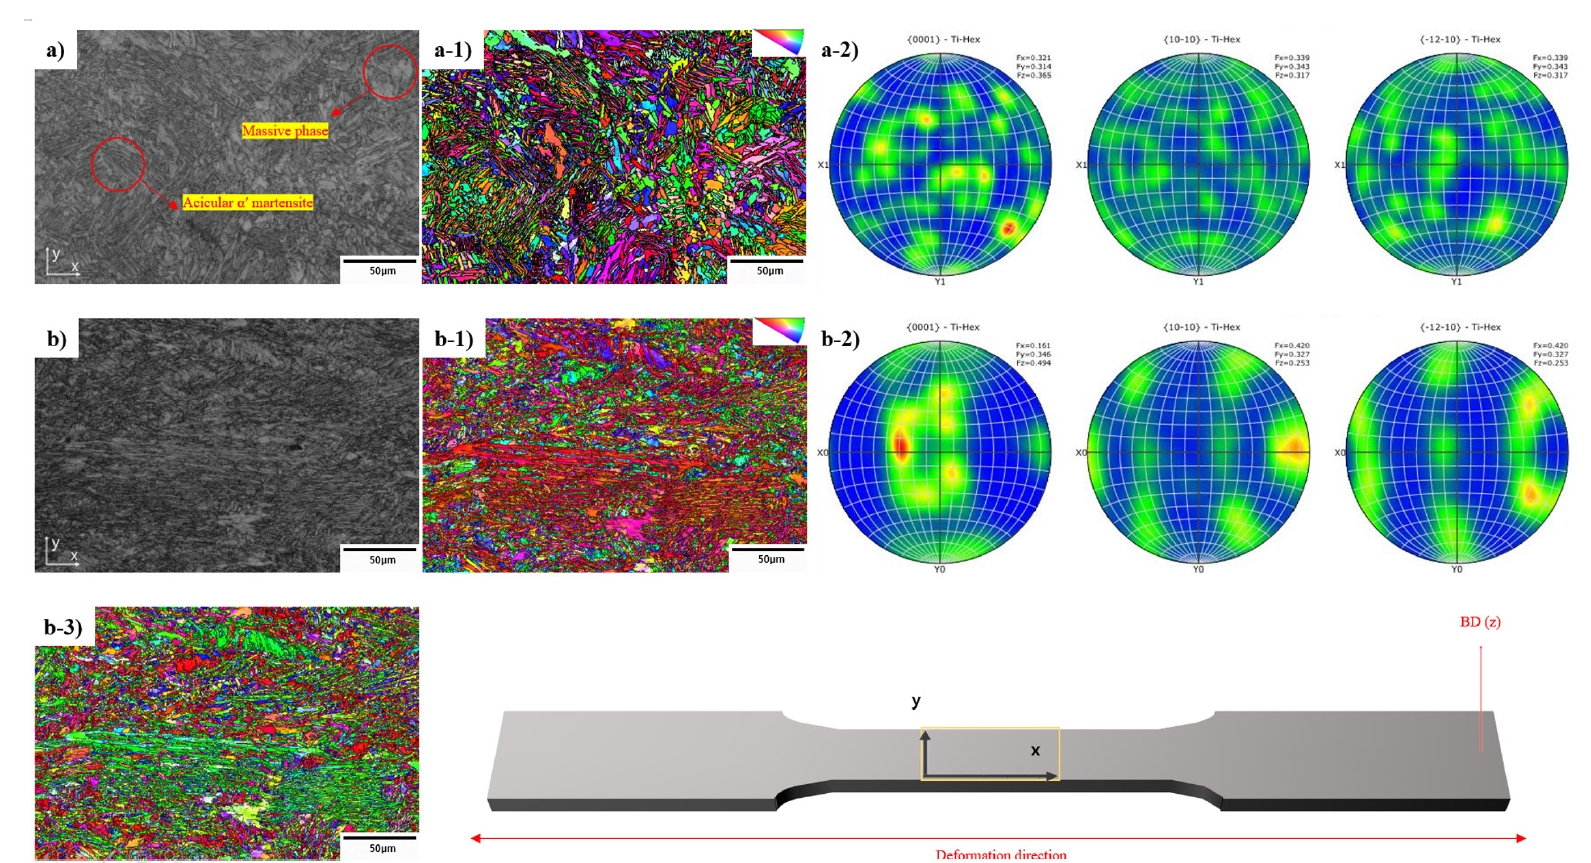
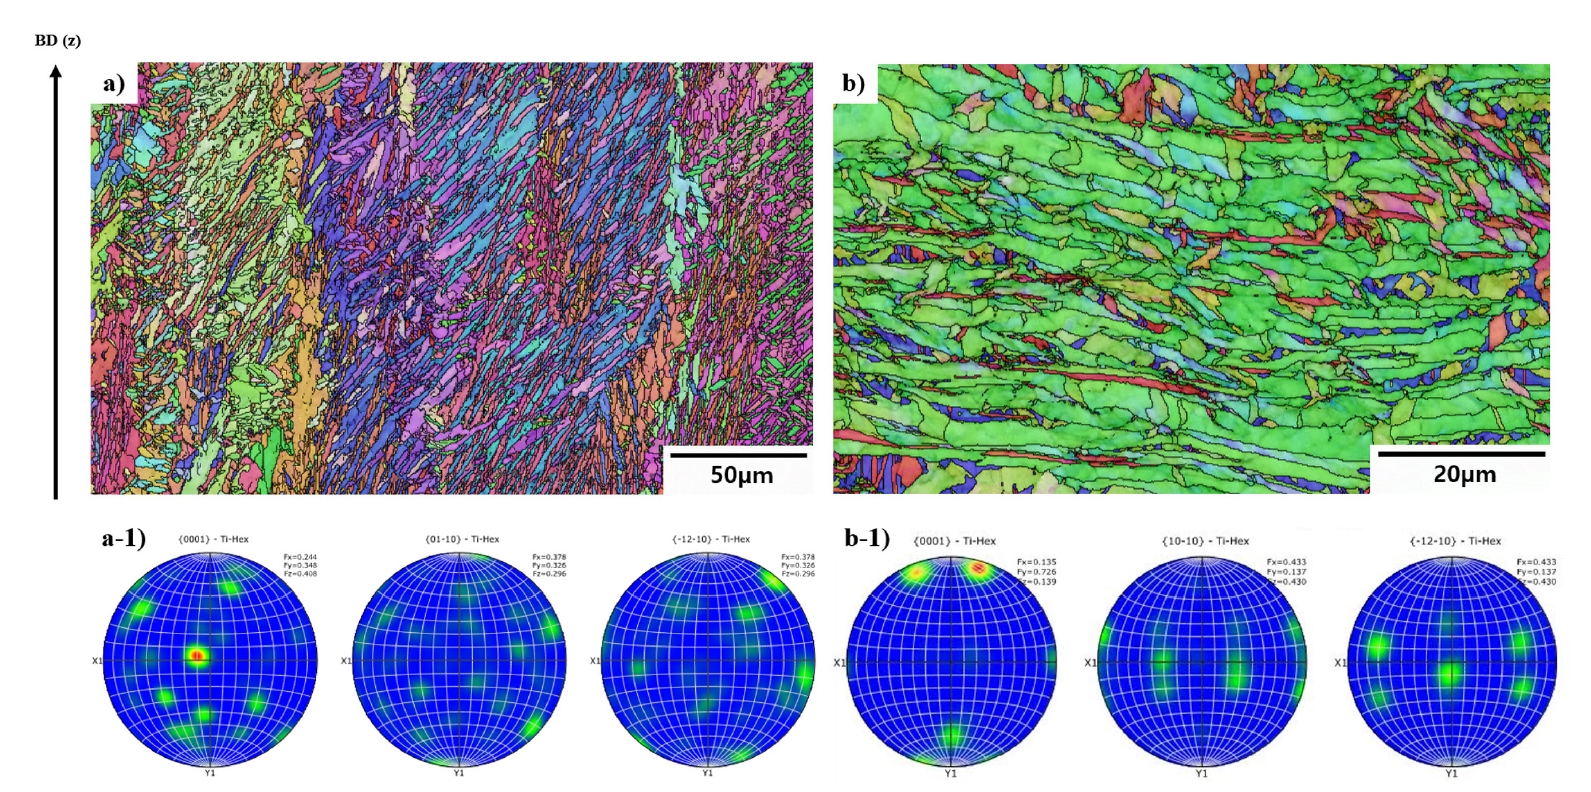

Fig. 1.
Fig. 2.
Fig. 3.
Fig. 4.
Fig. 5.
Fig. 6.
Fig. 7.
Fig. 8.
Fig. 9.
Fig. 10.
Fig. 11.
Graphical abstract
| Sample No. | Laser Power (W) | Scan Speed (mm/s) | Hatch Spacing (mm) | Layer Thickness (mm) | VED (J/mm³) |
|---|---|---|---|---|---|
| 1 | 30 | 100 | 0.14 | 0.03 | 71.43 |
| 2 | 50 | 100 | 0.14 | 0.03 | 119.05 |
| 3 | 80 | 100 | 0.14 | 0.03 | 190.48 |
| 4 | 100 | 100 | 0.14 | 0.03 | 238.10 |
| 5 | 120 | 100 | 0.14 | 0.03 | 285.71 |
| 6 | 30 | 200 | 0.14 | 0.03 | 35.71 |
| 7 | 50 | 200 | 0.14 | 0.03 | 59.52 |
| 8 | 80 | 200 | 0.14 | 0.03 | 95.24 |
| 9 | 100 | 200 | 0.14 | 0.03 | 119.05 |
| 10 | 120 | 200 | 0.14 | 0.03 | 142.86 |
| 11 | 30 | 300 | 0.14 | 0.03 | 23.81 |
| 12 | 50 | 300 | 0.14 | 0.03 | 39.68 |
| 13 | 80 | 300 | 0.14 | 0.03 | 63.49 |
| 14 | 100 | 300 | 0.14 | 0.03 | 79.37 |
| 15 | 120 | 300 | 0.14 | 0.03 | 95.24 |
| 16 | 30 | 400 | 0.14 | 0.03 | 17.86 |
| 17 | 50 | 400 | 0.14 | 0.03 | 29.76 |
| 18 | 80 | 400 | 0.14 | 0.03 | 47.62 |
| 19 | 100 | 400 | 0.14 | 0.03 | 59.52 |
| 20 | 120 | 400 | 0.14 | 0.03 | 71.43 |
| 21 | 30 | 500 | 0.14 | 0.03 | 14.29 |
| 22 | 50 | 500 | 0.14 | 0.03 | 23.81 |
| 23 | 80 | 500 | 0.14 | 0.03 | 38.10 |
| 24 | 100 | 500 | 0.14 | 0.03 | 47.62 |
| 25 | 120 | 500 | 0.14 | 0.03 | 57.14 |
| Sample No. | Laser Power (W) | Scan Speed (mm/s) | Hatch Spacing (mm) | Layer Thickness (mm) | VED (J/mm³) |
|---|---|---|---|---|---|
| 1 | 80 | 300 | 0.12 | 0.03 | 74.07 |
| 2 | 80 | 300 | 0.13 | 0.03 | 68.38 |
| 3 | 80 | 300 | 0.14 | 0.03 | 63.49 |
| 4 | 80 | 400 | 0.11 | 0.03 | 60.61 |
| 5 | 80 | 400 | 0.12 | 0.03 | 55.56 |
| 6 | 80 | 400 | 0.13 | 0.03 | 51.28 |
| 7 | 80 | 500 | 0.11 | 0.03 | 48.48 |
| 8 | 80 | 400 | 0.14 | 0.03 | 47.62 |
| 9 | 80 | 500 | 0.12 | 0.03 | 44.44 |
| 10 | 80 | 500 | 0.13 | 0.03 | 41.03 |
| 11 | 100 | 300 | 0.14 | 0.03 | 79.37 |
| 12 | 100 | 400 | 0.11 | 0.03 | 75.76 |
| 13 | 100 | 400 | 0.12 | 0.03 | 69.44 |
| 14 | 100 | 400 | 0.13 | 0.03 | 64.10 |
| 15 | 100 | 500 | 0.11 | 0.03 | 60.61 |
| 16 | 100 | 400 | 0.14 | 0.03 | 59.52 |
| 17 | 100 | 500 | 0.12 | 0.03 | 55.56 |
| 18 | 100 | 500 | 0.13 | 0.03 | 51.28 |
| 19 | 100 | 500 | 0.14 | 0.03 | 47.62 |
| 20 | 120 | 400 | 0.13 | 0.03 | 76.92 |
| 21 | 120 | 500 | 0.11 | 0.03 | 72.73 |
| 22 | 120 | 400 | 0.14 | 0.03 | 71.43 |
| 23 | 120 | 500 | 0.12 | 0.03 | 66.67 |
| 24 | 120 | 500 | 0.13 | 0.03 | 61.54 |
| 25 | 120 | 500 | 0.14 | 0.03 | 57.14 |
| HDH Ti | Spherical Ti | HDH Ti + Spherical Ti + SiO2 0.1 wt.% | |
|---|---|---|---|
| Apparent Density (g/cm3) | 1.42±0.04 | 2.48±0.02 | 2.04±0.02 |
| Tap Density (g/cm3) | 1.89±0.02 | 2.66±0.02 | 2.31±0.04 |
| Hausner Ratio | 1.33 | 1.08 | 1.14 |
| Powder | O2(ppm) | N2(ppm) |
|---|---|---|
| HDH Ti | 4,183.2 | 263.9 |
| Spherical Ti | 828.1 | 214.4 |
| HDH Ti + Spherical Ti + SiO2 | 3,132.6 | 323.1 |
| Sample | UTS (MPa) | YS (MPa) | Elongation (%) |
|---|---|---|---|
| ASTM grade 3 | 480 ~ 620 | 345 min | 18 min |
| ASTM grade 4 | 550 ~ 750 | 485 min | 15 min |
| L-PBF sample | 762.6±3.8 | 664.2±4.9 | 22.1±0.7 |
Table 1.
Table 2.
Table 3.
Table 4.
Table 5.
TOP
