
Articles
- Page Path
- HOME > J Powder Mater > Volume 33(1); 2026 > Article
-
Research Article
- Microstructure and Properties Comparison of Pure Cu and Cu-5 wt.% Al2O3 Composite Processed by Spark Plasma Sintering
-
Dinh Van Cong1
 , Dong-Wan Lee1, Su-Wan Lee1, Nguyen Minh Thuyet2,*, Nguyen Viet Hoang2, Jin-Chun Kim1,*
 -
Journal of Powder Materials 2026;33(1):51-60.
DOI: https://doi.org/10.4150/jpm.2025.00472
Published online: February 28, 2026
1School of Materials Science and Engineering, University of Ulsan, Ulsan, 4461, Republic of Korea
2Faculty of Materials Engineering, School of Materials Science and Engineering, Hanoi University of Science and Technology, Hanoi, 100000, Vietnam
-
*Corresponding author: Jin-Chun Kim E-mail: jckimpml@ulsan.ac.kr
*Corresponding author: Nguyen Minh Thuyet E-mail: thuyet.nguyenminh@hust.edu.vn
© The Korean Powder Metallurgy & Materials Institute
This is an Open Access article distributed under the terms of the Creative Commons Attribution Non-Commercial License (http://creativecommons.org/licenses/by-nc/4.0/) which permits unrestricted non-commercial use, distribution, and reproduction in any medium, provided the original work is properly cited.
- 1,244 Views
- 16 Download
Abstract
- This study compares the microstructure and properties of pure Cu and Cu-5 wt.% Al2O3 composites fabricated by spark plasma sintering under strictly identical processing conditions at 800-1000 °C. Pure Cu samples achieved near-full densification and exhibited a bimodal grain structure dominated by coarse grains with increasing sintering temperature. In contrast, the composite samples showed lower density and non-monotonic densification behavior, with a minimum relative density at 900 °C and significantly refined equiaxed grains due to strong grain-boundary pinning by nano Al2O3 particles. The higher fractions of high-angle boundaries and pronounced orientation disruption were observed in the composite samples, while high-resolution analysis confirmed the presence of grain-boundary Al2O3-rich regions that restricted Cu grain coalescence and continuity of grain boundary migration. X-ray diffraction results confirmed the absence of reaction phases in both materials. Hardness peaked at 900 °C for both samples, and the composite samples showed consistently lower hardness due to retained porosity. The apparent electrical conductivity of the composite displays a non-linear temperature dependence, reflecting the competing influences of densification, microstructural recovery, and the insulating nature of Al2O3.
- The addition of 5 wt.% nano-Al2O3 alters the sintering behavior of copper under SPS. The nanoparticles inhibit grain growth through boundary pinning, resulting in refined grains, enhanced electrical conductivity, but reduced hardness compared with fully densified coarse-grained pure copper.
Graphical abstract
- Copper (Cu) is widely used in electrical and thermal applications due to its excellent electrical and thermal conductivity and high ductility [1-5]. However, the relatively low mechanical strength and poor high-temperature stability of pure Cu limit its use in demanding engineering applications where high strength and wear resistance are required [6-8]. Reinforcement of Cu with ceramic dispersoids (Al2O3, ZrO2, SiO2, etc.) is an established route to enhance high-temperature strength and wear resistance while retaining reasonable conductivity [9-14]. Dispersion-strengthened Cu exhibits improved high-temperature performance due to particle pinning of grain and sub-grain boundaries and Orowan strengthening mechanisms.
- Alumina (Al2O3) is an attractive reinforcement for Cu due to its high melting point, high elastic modulus and hardness, chemical stability, and good wear resistance [15-18]. When incorporated into a Cu matrix, Al2O3 particles can significantly increase strength and wear resistance; these properties make Cu-Al2O3 composites relevant for industrial applications such as spot-welding electrodes, heat-dissipating components, and wear-resistant electrical contacts.
- Conventional consolidated processes for Cu-Al2O3 composites include pressure-less sintering, hot pressing (HP), hot isostatic pressing (HIP), hot extrusion, and infiltration [19-23]. These methods suffer from various limitations, such as high sintering temperatures and long cycle times, leading to grain growth and coarsening of dispersoids, poor interfacial bonding or agglomeration of ceramic particles, and difficulty in achieving full densification without excessive matrix grain growth. Such shortcomings can degrade mechanical and functional properties of composites.
- Spark plasma sintering (SPS), also referred to as pulsed electric current sintering (PECS), has emerged as an effective consolidation technique for metal matrix composites because it enables very high heating rates, short dwell times, and relatively low sintering temperatures, promoting rapid densification while suppressing matrix grain growth and limiting particle coarsening [24-29]. These characteristics often result in finer microstructures, improved particle-matrix interfaces, and enhanced mechanical and functional properties compared with conventional sintering approaches. SPS has therefore been widely applied to Cu-Al2O3 and related systems. However, most previous studies primarily focus on composite samples alone, while the intrinsic sintering response of pure Cu processed under identical SPS conditions is rarely examined as a direct benchmark. As a result, the specific role of Al2O3 addition in modifying densification behavior, grain evolution, and transport properties during SPS remains insufficiently clarified.
- The present work aims to compare the microstructure and properties of pure Cu and a Cu-5 wt.% Al2O3 composite consolidated by SPS across a range of sintering temperatures. The objectives are to evaluate densification and grain/particle evolution with temperature, characterize particle-matrix interfaces, and correlate microstructural features with hardness and electrical performance to identify optimal sintering conditions for balanced properties in Cu-Al2O3 composites.
1. Introduction
- 2.1 Materials and Methods
- Gas-atomized copper powder (99% purity, particle size 15-45 μm) and nano-sized Al2O3 powder (99% purity, average particle size of 135 nm) were used as the starting materials. The powders were weighed to obtain a composition of 95 wt.% Cu and 5 wt.% Al2O3, followed by mixing using a laboratory-scale horizontal roller ball mill at 200 rpm for 4 h. A reinforcement content of 5 wt.% Al2O3 was intentionally selected to promote strong grain-boundary pinning and the formation of Al2O3-rich boundary regions, enabling a clear assessment of microstructural evolution and property trade-offs under identical SPS conditions. The morphology of the starting powders and Cu-5 wt.% Al2O3 powder after mixing is shown in Fig. 1. The EDS elemental mappings confirm the relatively homogeneous distribution of Al2O3 nanoparticles over the Cu surfaces.
- Consolidation of pure Cu and Cu-5 wt.% Al2O3 powders was carried out using a spark plasma sintering system (SPS-515S, Dr. Sinter Lab, Japan). These powders were loaded into a graphite die with an inner diameter of 15 mm, and a uniaxial pressure of 50 MPa was applied throughout sintering process. The samples were heated at a rate of 100°C/min and sintered at three different temperatures at 800°C, 900°C, and 1000°C, and held for 5 min before rapid cooling under a water-assisted cooling system. To prevent adhesion between the mold and the compact, the graphite die and punches were coated with a thin graphite layer before sintering.
- 2.2 Characterization
- The consolidated samples were subsequently characterized as density, microstructure, mechanical, and electrical properties. Bulk density was measured according to Archimedes’ principle. Microstructural observations were performed using optical microscopy (OM, Olympus 53M, Japan), scanning electron microscopy (SEM, JEOL JSM-6500F, Japan), electron backscatter diffraction (EBSD, FE-SEM-S500 equipped with Velocity™ EBSD camera system, Japan), and X-ray diffraction (XRD, Rigaku Ultima IV, Japan).
- Mechanical performance was assessed through Vickers microhardness testing (Mitutoyo HM-220D, Japan) using a load of 25 gf and a dwell time of 10 s. Electrical conductivity measurements were conducted on polished samples at room temperature using the impedance grain phase analyzer (Hewlett Packard 4194A). To ensure reliability, all density, microhardness, and electrical conductivity measurements were repeated five times under identical conditions, and the average values were reported.
2. Experimental Section
- 3.1 Density and microstructure of sintered samples
- Fig. 2 illustrates the evolution of relative density for pure Cu and the Cu-5 wt.% Al2O3 samples as a function of sintering temperature. It can be seen that the pure copper sample exhibits consistently high densification, increasing slightly from approximately 98.6% at 800 °C to around 99.7% at 1000 °C, corresponding to a monotonic decrease in apparent porosity with increasing SPS temperature. In contrast, the Cu-5 wt.% Al2O3 composite samples demonstrate lower relative density across all temperatures, indicating a higher retained porosity compared with pure Cu. The composite sample shows a slight decrease in density at 900 °C, reaching a minimum of 94.6%, before increasing again to 95.6% at 1000 °C, which implies a non-monotonic evolution of porosity with sintering temperature. The reduced densification at 900 °C is attributed to the combined effects of particle rearrangement limitation and pore stabilization induced by Al2O3-rich regions at particle boundaries. At this intermediate temperature, the diffusion activity of Cu is enhanced compared to 800 °C but remains insufficient to overcome the diffusion barrier imposed by the oxide phase, leading to pore coalescence and partial pore entrapment rather than effective pore elimination, thereby temporarily increasing the effective porosity of the composite. When the sintering temperature is increased to 1000 °C, further enhancement of atomic diffusion and localized plastic deformation of the Cu matrix under the applied pressure promotes pore shrinkage and interparticle neck growth, resulting in a reduction of residual porosity and improved interparticle connectivity. This results in a partial breakdown of the pore-stabilizing effect of Al2O3-rich boundary regions and enables additional densification, although the final density remains lower than that of pure Cu due to the persistent constraint imposed by the oxide phase, which continues to limit complete pore elimination.
- Fig. 3 reveals distinct differences in the microstructural evolution of pure Cu and the Cu-5 wt.% Al2O3 composite samples during SPS. For pure Cu samples, pore elimination is evident with increasing temperature. At 800 °C, residual pores (indicated by red arrows) are primarily localized at powder boundaries, whereas at 1000 °C, significant blurring of the powder boundaries with reduced porosity is observed. In contrast, the Cu-5 wt.% Al2O3 composite samples exhibit restricted grain growth and persistent porosity across all temperatures. The Al2O3 particles (indicated by yellow arrows) are predominantly situated at triple junctions of the copper powder boundary, exerting a pinning effect [30-32] that impedes grain boundary migration and matrix diffusion. At 1000°C, although enhanced diffusion promotes partial pore elimination, the Al2O3 particles continue to act as diffusion barriers, resulting in significantly higher residual porosity compared to pure copper.
- For a more detailed assessment of the microstructural evolution, SEM observations of the sintered samples are presented in Fig. 4. For the pure Cu samples, pore size progressively decreases, and grain growth becomes more pronounced with increasing sintering temperature. At 900 °C, the well-defined annealing twins, typical of face-centered cubic copper, are clearly visible within the grains, while substantial grain coarsening occurs at 1000 °C. In contrast, the Cu-5 wt.% Al2O3 composite samples exhibit a markedly different behavior. The ceramic particles preferentially segregate along Cu grain boundaries, forming Al2O3-rich regions at 800 °C. At 900 °C, significant residual porosity remains concentrated near the Cu/Al2O3 interfaces, which explains the decrease in density at this temperature. Although higher temperatures enhance bonding between Cu grains, the ceramic phase continues to pin grain boundaries and restrict diffusion, resulting in persistent porosity and limited densification even at 1000 °C. These microstructural characteristics strongly influence the resulting material properties, as grain boundary integrity and second-phase distribution play critical roles in determining the mechanical performance of the composites.
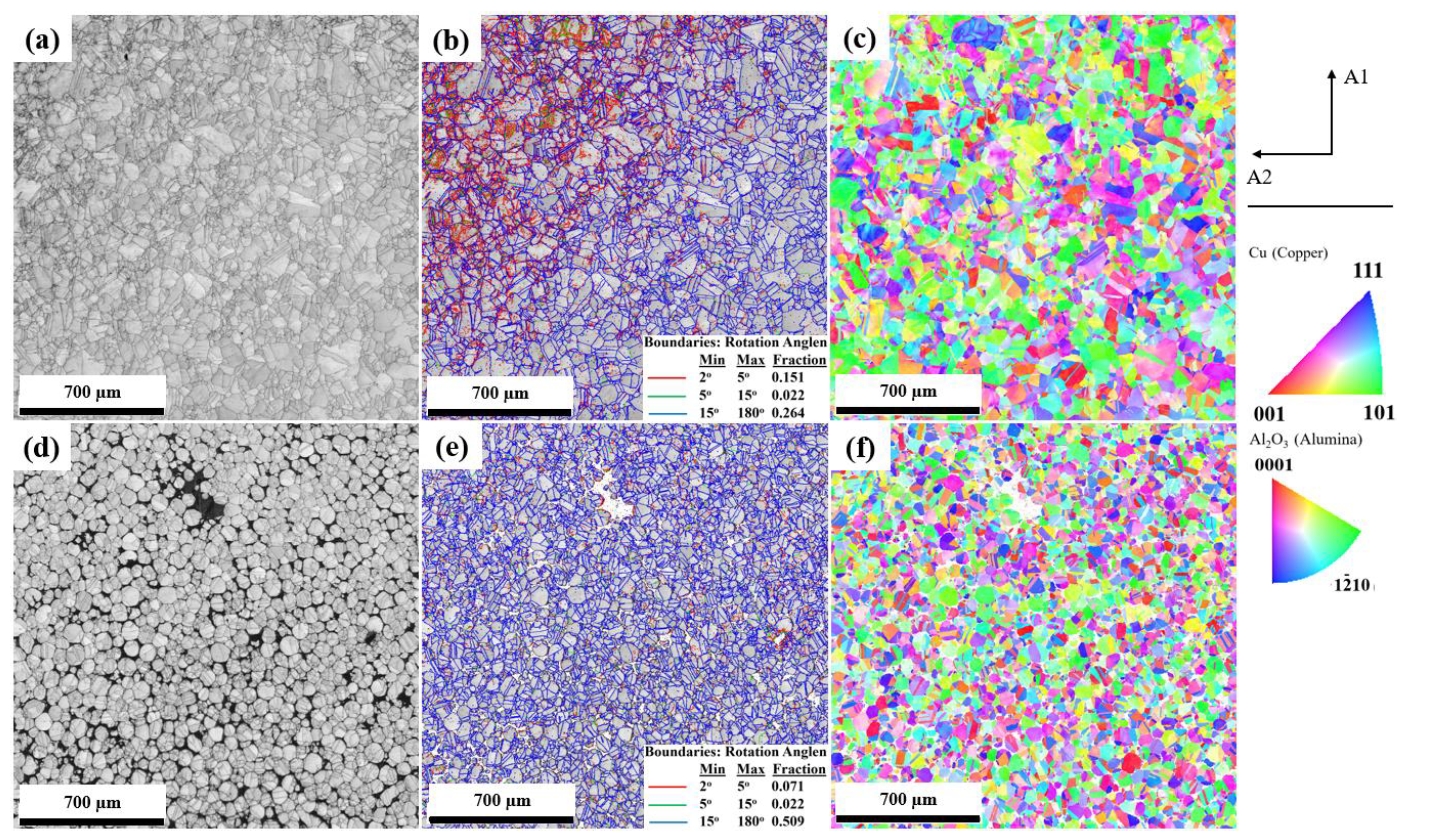
- The texture characteristics of the pure Cu and Cu-5 wt.% Al2O3 composite samples sintered at 1000 °C were evaluated using the EBSD maps presented in Fig. 5. Because the Al2O3 particles are nanometric and lie below the EBSD spatial resolution, these obtained maps primarily represent the crystallographic behavior of the Cu matrix. The results indicate that pure Cu undergoes extensive recrystallization and grain coarsening during sintering, whereas the Cu-5 wt.% Al2O3 composite maintains a refined grain structure with clear orientation interruptions caused by grain boundary pinning effect of the dispersed Al2O3 particles, which suppressed grain growth. The image quality (IQ) maps reveal that pure Cu develops a bimodal grain structure consisting of coarse recrystallized grains (35~70 μm) surrounded by much finer grains, reflecting active boundary migration at high temperature. In contrast, the composite exhibits a more homogeneous equiaxed grain structure with significantly smaller grains due to the pinning effect of the dispersed Al2O3 particles. Quantitative grain boundary misorientation analysis further shows that pure Cu contains a high-angle grain boundary (HAGB, >15°) fraction of approximately 26.4%, whereas the composite exhibits a markedly higher HAGB fraction of ~50.9%, accompanied by a reduced low-angle grain boundary (LAGB, 2-15°) fraction of ~9.3%. The grain boundary (GB) maps show that both samples contain predominantly HAGBs. However, the composite displays a higher HAGB fraction and markedly fewer annealing twins than pure Cu, consistent with restricted recrystallization and reduced boundary mobility. The increased HAGB fraction in the composite is attributed to oxide-pinning-induced grain subdivision and limited grain boundary migration rather than enhanced grain growth. The inverse pole figure (IPF) maps further show that pure Cu possesses large grains with a completely random orientation distribution, characteristic of unrestricted recrystallization, whereas the composite displays smaller grains whose orientations are locally disrupted by grain-boundary Al2O3-rich regions. In addition, the grain size distribution of these samples is illustrated in Fig. 6. The pure Cu sample exhibits an average grain size of 57.83 μm with a broad distribution ranging from approximately 7 to 170 μm, indicating extensive grain growth during sintering. In contrast, the composite sample shows a smaller average grain size of 36.54 μm and a noticeably narrower distribution of 5 to 96 μm.
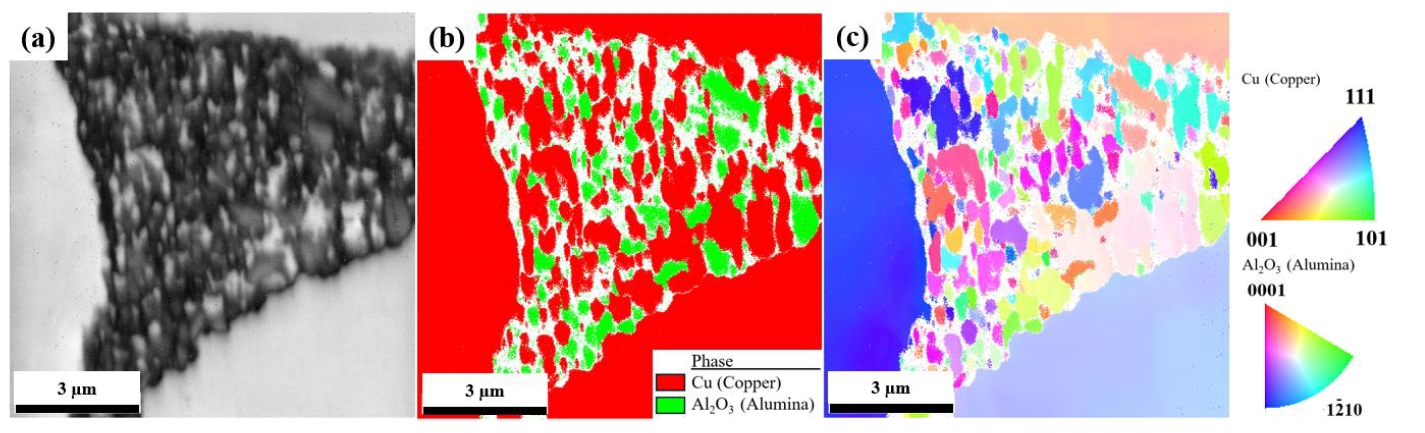
- Higher resolution EBSD analyses were performed to observe the structure at the grain-boundary Al2O3-rich region in the composite samples sintered at 1000 °C, as shown in Fig. 7. The IQ map reveals a highly heterogeneous microstructure in which Cu grains are fragmented and irregularly shaped due to the presence of densely packed ceramic particles. The phase map confirms that the Al2O3 phase surrounds and separates the Cu grains, effectively impeding their coalescence and restricting grain boundary migration. Quantitative phase analysis indicates that although the total Al2O3 fraction is ~10.3%, its partition fraction within grain-boundary regions increases to ~12.9%, demonstrating preferential Al2O3 enrichment at grain boundaries .This morphology indicates that although local diffusion attempts to promote bonding between adjacent Cu grains, the nano-oxide phase acts as a strong physical barrier, preventing full densification in this region. The IPF map further shows that the crystallographic orientations of the Cu grains in the Al2O3-rich zone are completely random, with no evidence of texture development. This lack of preferred orientation suggests that the grain-boundary Al2O3-rich regions interrupt recrystallization pathways and inhibit grain growth. These results demonstrate that the nano-Al2O3 phase plays a dominant role in controlling the local microstructure by blocking Cu diffusion and limiting grain coalescence.
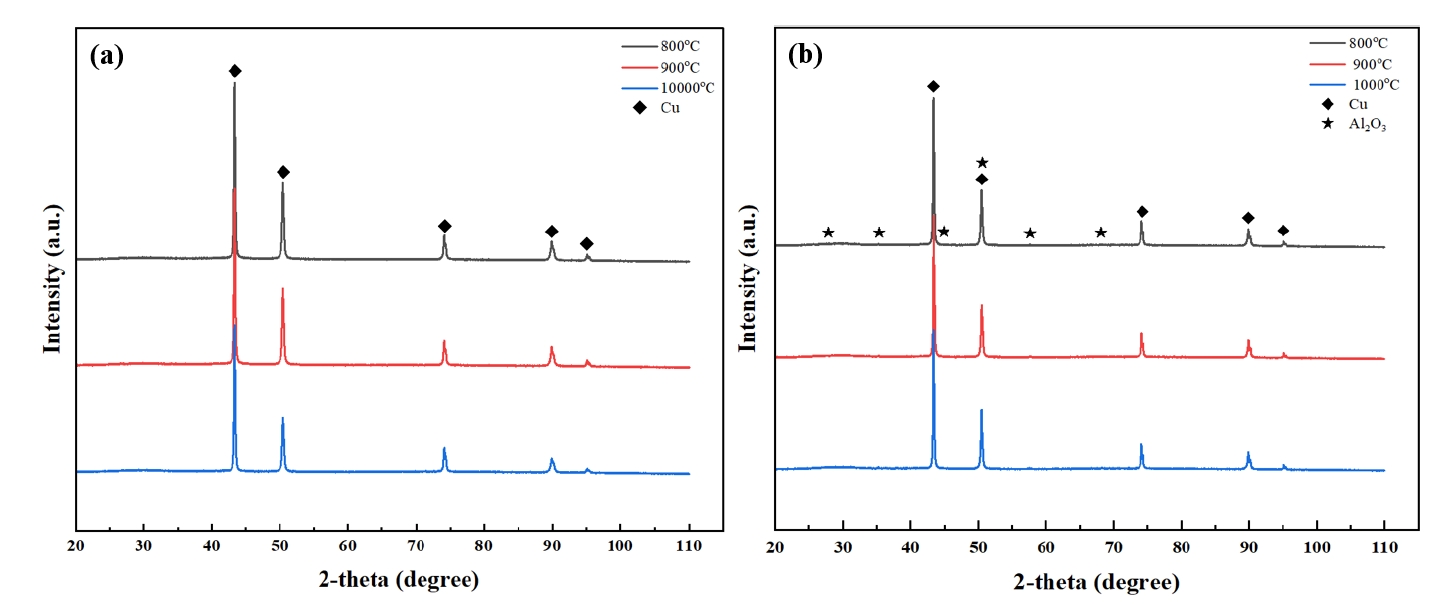
- Fig. 8 presents the XRD patterns of the pure Cu and Cu-5 wt.% Al2O3 composite samples sintered at 800, 900, and 1000 °C. For the pure Cu samples, only the characteristic diffraction peaks of face-centered cubic Cu are detected, indicating the absence of secondary phases formed during the SPS process. In the Cu-5 wt.% Al2O3 composites, the diffraction peaks corresponding to Al2O3 are significantly weaker and broader than those of the Cu matrix. Although the nominal Al2O3 content corresponds to a non-negligible volume fraction, the weak Al2O3 reflections are associated with the combined effects of the nanoscale size of the Al2O3 particles, their high dispersion within the Cu matrix, and the dominance of the strong Cu diffraction peaks. The nanosized Al2O3 particles result in pronounced peak broadening and reduced peak intensity, while partial peak overlapping with the Cu reflections further limits their detectability in conventional XRD scans. Furthermore, the diffraction patterns of all samples exhibit similar features across the different sintering temperatures. These results indicate that no significant phase transformation, impurity introduction, or interfacial reaction occurs during SPS, confirming the thermodynamic stability of both Cu and Al2O3 under the applied sintering conditions.
- 3.2 Mechanical properties and electrical conductivity of sintered samples
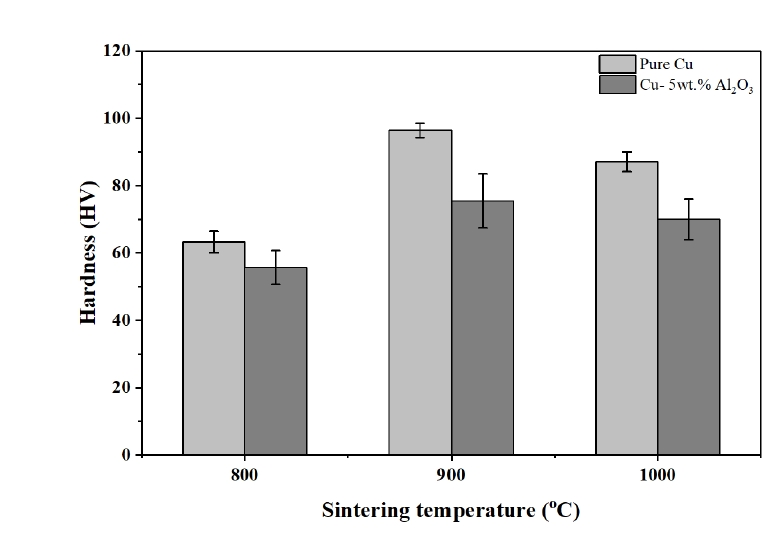
- The hardness evolution of the pure Cu and Cu-5 wt.% Al2O3 composite samples after sintering is presented in Fig. 9. For pure Cu samples, hardness increases from 63 HV at 800 °C to 96 HV at 900 °C, and then slightly decreases to around 88 HV at 1000 °C due to grain coarsening effect dominant. The maximum hardness observed at 900 °C reflects an optimal balance between enhanced densification, which effectively reduces porosity (Fig. 2), and limited grain growth, allowing grain boundary strengthening to be largely retained. The composite samples display lower hardness values than pure Cu samples at all temperatures, increasing from 56 HV at 800 °C to 76 HV at 900 °C before slightly dropping at 1000 °C. The reduced hardness in the composite samples compared with pure Cu samples is attributed to the presence of grain-boundary Al₂O₃-rich regions that inhibit uniform grain growth and lead to retained porosity, limiting the strengthening contribution from grain refinement. Although grain refinement would normally enhance hardness according to the Hall-Petch relationship, the strengthening contribution from finer grains in the composite is substantially offset by the detrimental effect of residual porosity. In addition, the effective reinforcement of Al2O3 particles strongly depends on interfacial load transfer. The absence of interfacial reaction phases suggests that the Al2O3/Cu interface is primarily mechanically bonded, which limits stress transfer from the Cu matrix to the ceramic phase. Consequently, the combined effects of residual porosity and limited interfacial load transfer outweigh the potential strengthening from the hard ceramic phase and grain refinement, resulting in lower hardness compared to near-fully dense pure Cu. While grain structure evolution governs the overall temperature-dependent trend in hardness for both materials, the absolute hardness of the composite is primarily controlled by its porosity-dominated response.
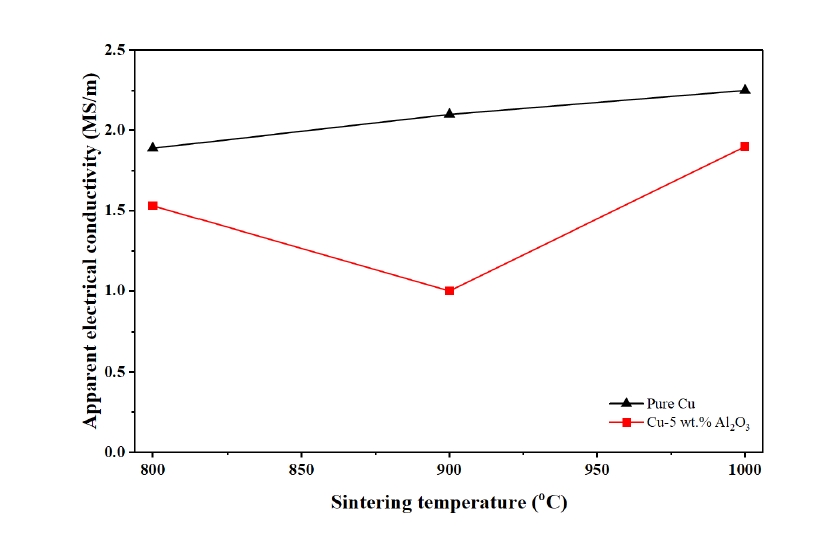
- Fig. 10 presents the apparent electrical conductivity of pure Cu and Cu-5 wt.% Al2O3 composites sintered at different temperatures. As expected, the composite samples exhibit consistently lower conductivity than pure Cu at all sintering temperatures, primarily due to the presence of the electrically insulating Al2O3 phase and microstructural discontinuities that enhance electron scattering. For pure Cu samples, the apparent electrical conductivity increases monotonically from approximately 1.89 MS/m at 800 °C to 2.25 MS/m at 1000 °C. This behavior indicates that, for nearly fully dense pure Cu, electrical transport is not governed solely by densification but is also influenced by microstructural recovery and improved interparticle bonding at higher sintering temperatures, which reduce defect- and interface-related electron scattering. In contrast, the Cu-5 wt.% Al2O3 composite samples exhibit a non-monotonic trend, with the apparent electrical conductivity decreasing from about 1.53 MS/m at 800 °C to a minimum of approximately 1.00 MS/m at 900 °C, followed by a pronounced increase to around 1.90 MS/m at 1000 °C. The reduced conductivity at 900 °C can be attributed to the combined effects of retained porosity, finer grain size, and Al2O3-rich regions, which collectively increase grain-boundary- and interface-related electron scattering. At 1000 °C, improved interparticle contact and partial grain coarsening mitigate these scattering effects, leading to a recovery of the apparent electrical conductivity. It should be noted that the measured values represent the apparent electrical conductivity of sintered compacts, which is influenced by porosity, interparticle contact quality, and contact resistance. Therefore, the data are mainly intended for comparative trend analysis rather than intrinsic conductivity evaluation.
3. Results and Discussion
- In this study, the microstructure and properties of pure Cu and Cu-5 wt.% Al2O3 composites fabricated by SPS process at 800-1000 °C were investigated. The results indicated that the introduction of 5 wt.% nano-Al2O3 markedly alters the sintering response and final properties of copper. Pure Cu samples achieved near-full densification (98.6-99.7%) and developed a coarsen microstructure with an average grain size of 57.83 μm, whereas the composite exhibited lower density (94.6-95.6%) and significantly refined grains averaging 36.54 μm due to the strong boundary-pinning effect of the nano-oxide phase. Notably, the composite showed a density minimum at an intermediate sintering temperature, highlighting the competing effects between enhanced Cu diffusion and oxide-induced pore stabilization. High-resolution EBSD confirmed that the grain-boundary Al2O3-rich regions restrict Cu grain coalescence and produce disrupted orientation fields without inducing any reaction phases during sintering. These microstructural distinctions are reflected in the mechanical and electrical properties. The pure Cu samples reached a maximum hardness of 96 HV at 900 °C, while the composite samples remained softer (56-76 HV) primarily due to retained porosity that limits effective grain-boundary strengthening. In addition, the composite samples exhibit a non-monotonic change in apparent electrical conductivity with sintering temperature, while pure Cu consistently shows higher apparent electrical conductivity across all temperatures.
4. Conclusion
-
Funding
(1) These results were supported by "Regional Innovation Strategy (RIS)" through the National Research Foundation of Korea (NRF) funded by the Ministry of Education (MOE)(2021RIS-003).
(2) This work was supported by the Technology Innovation Program (No. 20017647, Development of oxide dispersion strengthened superalloy materials and manufacturing technology for hypersonic engines.) funded by the Ministry of Trade, Industry & Energy (MOTIE, Korea).
-
Conflict of Interest
The authors have no conflicts of interest to declare.
-
Data Availability Statement
All data generated or analyzed during this study are includedin this article.
-
Author Information and Contribution
Dinh Van Cong: PhD candidate; responsible for conceptualization, data curation, formal analysis, investigation, methodology, visualization, writing-original draft.
Dong-Wan Lee: PhD; contributed to data curation and investigation.
Su-Wan Lee: PhD candidate; contributed to data curation and investigation.
Nguyen Minh Thuyet: Professor, contributed to reviewing and editing the manuscript.
Nguyen Hoang Viet: Professor, contributed to reviewing and editing the manuscript.
Jin-Chun Kim: Professor, provided supervision, validation, funding acquisition, review, and editing of the final manuscript.
-
Acknowledgments
None.
Article information


- 1. H. Y. Yang, Z. C. Ma, C. H. Lei, L. Meng, Y. T. Fang, J. B. Liu and H. T. Wang: Sci. China Technol. Sci., 63 (2020) 2505.ArticlePDF
- 2. Y. H. Choong, M. Krishnan and M. Gupta: Technologies, 11 (2023) 141.Article
- 3. Z. D. Li, C. G. Lin and S. Cui: Adv. Mater. Res., 1053 (2014) 61.Article
- 4. D. E. Tyler and W. T. Black, Properties and Selection: Nonferrous Alloys and Special-Purpose Materials, ASM International, OH (1990) 216.Article
- 5. M. Kutz, Mechanical Engineers’ Handbook: Materials and Mechanical Design, 3rd edJohn Wiley & Sons, New York (2006) 1.
- 6. X. Zhang, Y. Yuan, S. Zhao, J. Zhang and Q. Yan: Nucl. Mater. Energy, 30 (2022) 101123.Article
- 7. Q. Mao, Y. Zhang, Y. Guo and Y. Zhao: Commun. Mater., 2 (2021) 46.Article
- 8. C. Saldana, A. H. King and S. Chandrasekar: Acta Mater., 60 (2012) 4107.Article
- 9. Y.-Q. Qin, Y. Tian, Y.-Q. Peng, L.-M. Luo, X. Zan, Q. Xu and Y.-C. Wu: J. Alloys Compd., 848 (2020) 156475.Article
- 10. M. Elmahdy, G. Abouelmagd and A. A. E. Mazen: Mater. Res., 21 (2018) e20170387.Article
- 11. J. Groza: J. Mater. Eng. Perform., 1 (1992) 113.ArticlePDF
- 12. Y. H. Kim, C. W. Kim, H.G. Cha, H. J. Cha, Y. C. Kang, Y. S. Kang, B. K. Jo and G. W. Ahn: Mol. Cryst. Liq. Cryst., 472 (2007) 217.Article
- 13. X. Su, J. Zhao, X. Zhao, Y. Guo, Y. Zhu and Z. Wang: Nanotechnology, 19 (2008) 365610.Article
- 14. A. Fathy, O. Elkady and A. Abu-Oqail: J. Alloys Compd., 719 (2017) 411.Article
- 15. B. Tian, P. Liu, K. Song, Y. Li, Y. Liu, F. Ren and J. Su: Mater. Sci. Eng. A, 435-436 (2006) 705.Article
- 16. Y. Fu, Q. Pan, Z. Cao, S. Li and Y. Huo: J. Alloys Compd., 798 (2019) 616.Article
- 17. X. Y. Ding, Y. C. Fu, B. Li, S. Lin, L.-M. Luo, Y.-C. Wu and J.-H. Yao: Mater. Des., 258 (2025) 114547.Article
- 18. Z. Q. Yan, F. Chen, F.X. Ye, D. P. Zhang and Y. X. Cai: Int. J. Miner. Metall. Mater., 23 (2016) 1437.ArticlePDF
- 19. G. H. Zhang, X. S. Jiang, Z. Y. Shao, H. L. Sun, Q. Ma and Z. P. Luo: Mater. Res. Express, 6 (2019) 116513.ArticlePDF
- 20. N. A. Travitzky and A. Shlayen: Mater. Sci. Eng. A, 244 (1998) 154.Article
- 21. S. Nachum, N. A. Fleck, M. F. Ashby, A. Collea and P. Matteazzi: Mater. Sci. Eng. A, 527 (2010) 5065.Article
- 22. M. Amirjan, H. Khorsand, M. H. Siadati and R. E. Farsani: J. Mater. Res. Technol., 2 (2013) 351.Article
- 23. F. Ren, A. Zhi, D. Zhang, B. Tian, A. A. Volinsky and X. Shen: J. Alloys Compd., 633 (2015) 323.Article
- 24. Y. Pan, S.Q. Xiao, X. Lu, C. Zhou, Y. Li, Z. W. Liu, B. W. Liu, W. Xu, C. C. Jia and X. H. Qu: J. Alloys Compd., 782 (2019) 1015.Article
- 25. N. Sharma, S. N. Alam and B. C. Ray, Spark Plasma Sintering of Materials, Elsevier, Amsterdam (2019) 21.Article
- 26. N. Saheb, Z. Iqbal, A. Khalil, A. S. Hakeem, N. A. Aqeeli, T. Laoui, A. Al-Qutub and R. Kirchner: J. Nanomater., 2012 (2012) 983470.Article
- 27. O. E. Falodun, B. A. Obadele, S. R. Oke, A. M. Okoro and P. A. Olubambi: Int. J. Adv. Manuf. Technol., 102 (2019) 1689.ArticlePDF
- 28. S. O. Jeje, M. B. Shongwe, A. L. Rominiyi and P. A. Olubambi: Int. J. Adv. Manuf. Technol., 117 (2021) 2529.ArticlePDF
- 29. X. Y. Li, Z. H. Zhang, X. W. Cheng, G. J. Huo, S. Z. Zhang and Q. Song: Powder Metall. Met. Ceram., 60 (2021) 410.ArticlePDF
- 30. Z. Trojanová, H. Ferkel, P. Lukáč, J. Naser and W. Riehemann: Scr. Mater., 40 (1999) 1063.Article
- 31. V. Rajković, D. Božić and M.T. Jovanović: J. Alloys Compd., 459 (2008) 177.Article
- 32. D. Zhou, Z. Quadir, C. Kong, H. Pan, Z. Liu, G. Sha, P. Munroe and D. Zhang: Materialia, 4 (2018) 268.Article
References
Figure & Data
References
Citations
 ePub Link
-
 Cite this Article
- Cite this Article
-
- Close
- Download Citation
- Close
- Figure
-


- Related articles
-
- Microstruture and Mechanical Properties of Ti.Grade12-Ti/TiN/WC Composite Produced by Spark Plasma Sintering Process
- Fabrication and Optimization of Al2O3 Microchannels Using DLP-Based 3D Printing
- Microstructures and Mechanical Properties of Al-B4C Composites Fabricated by DED Process
- Microstructure and Characteristics of Ag-SnO2-Bi2O3 Contact Materials by Powder Compaction
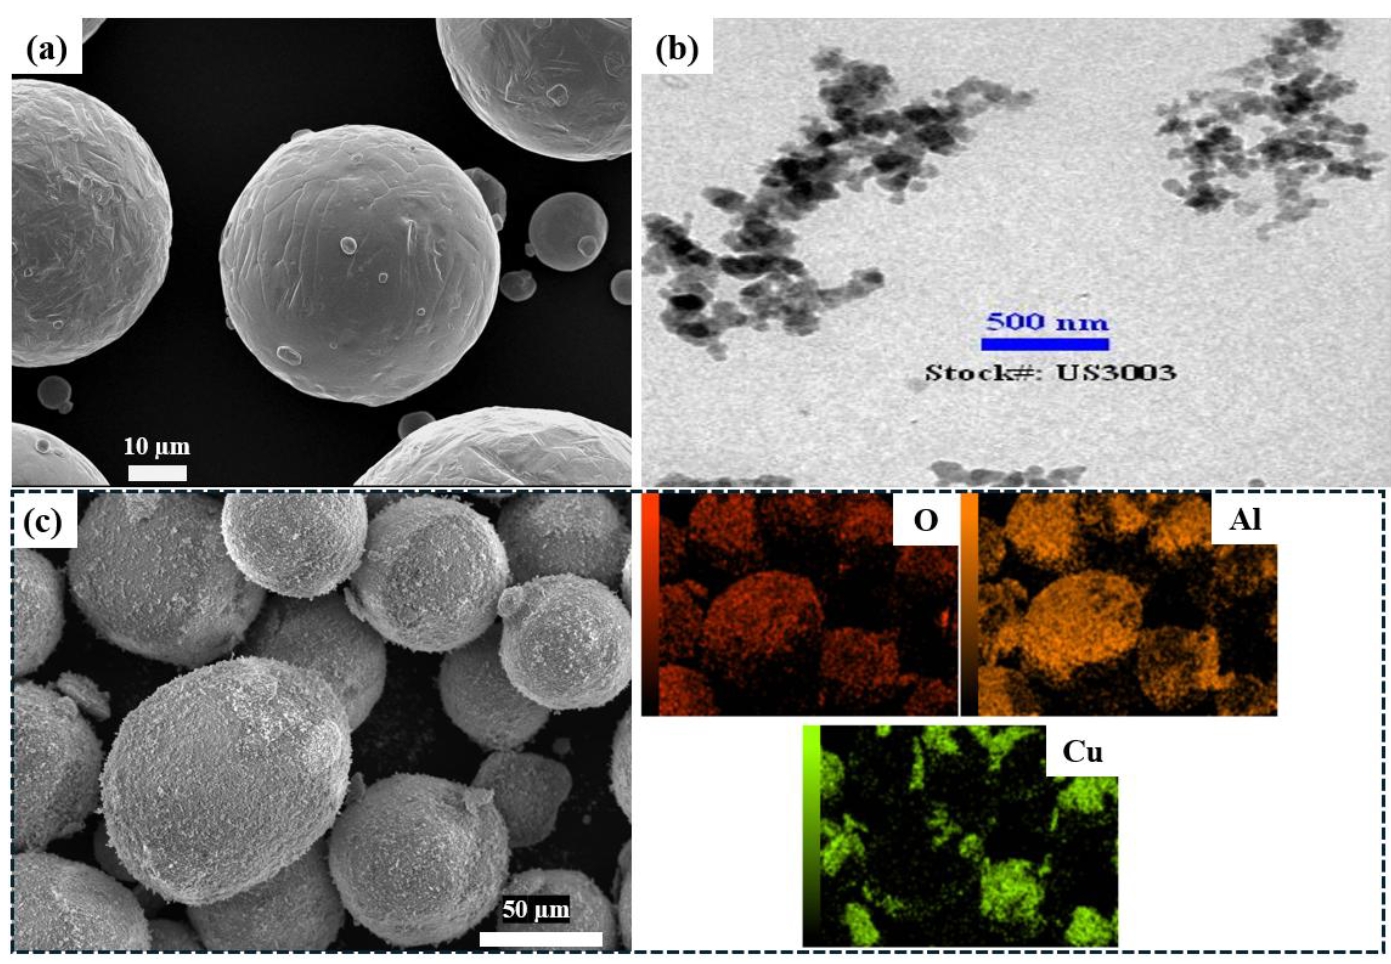
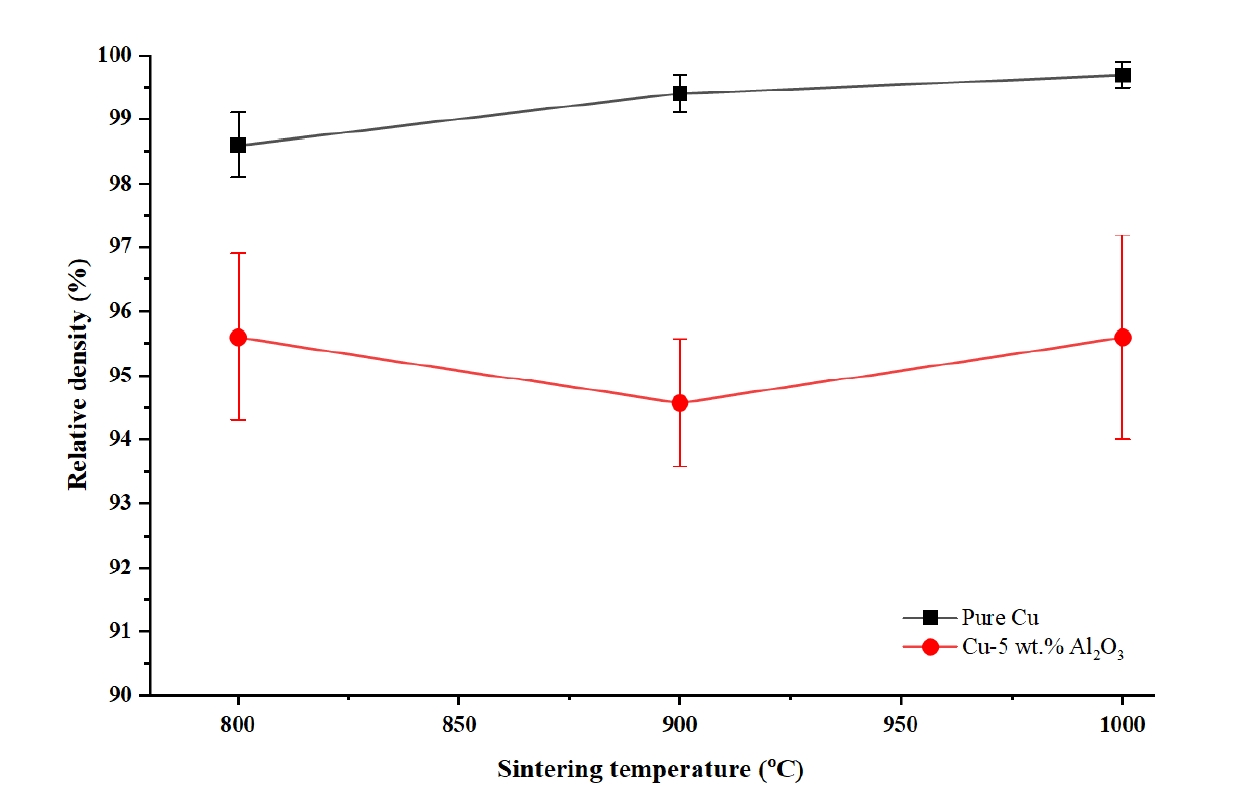
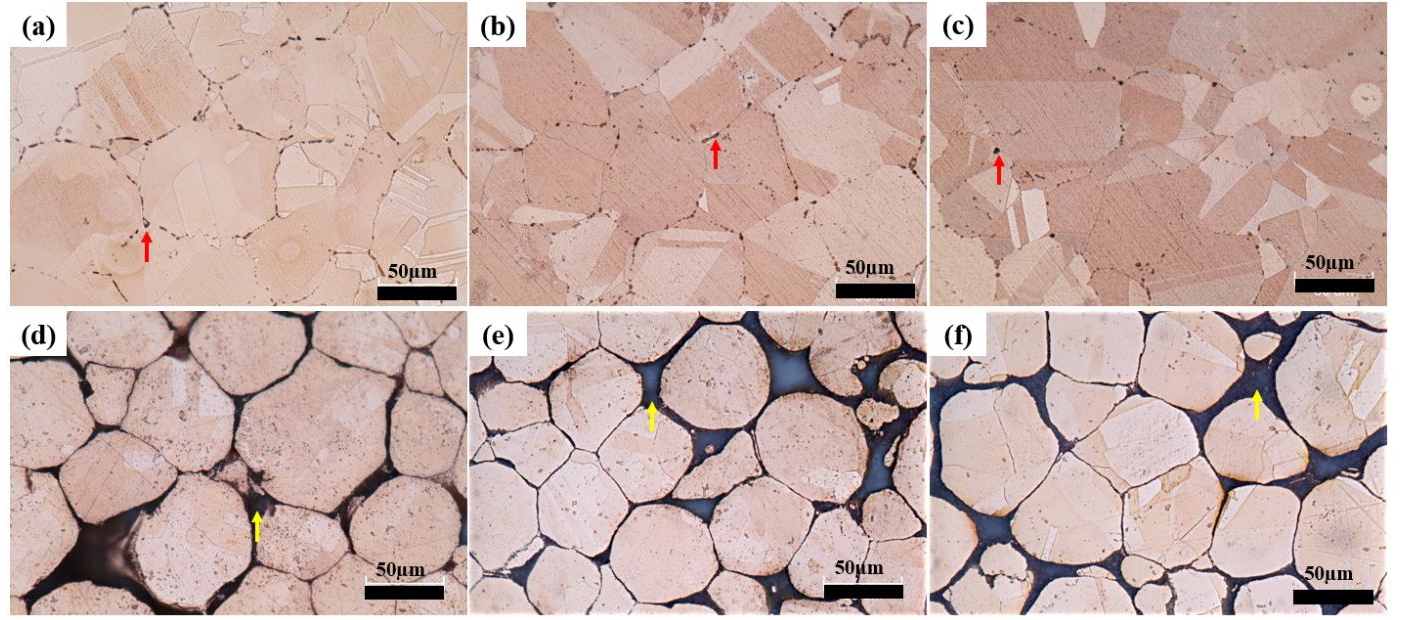
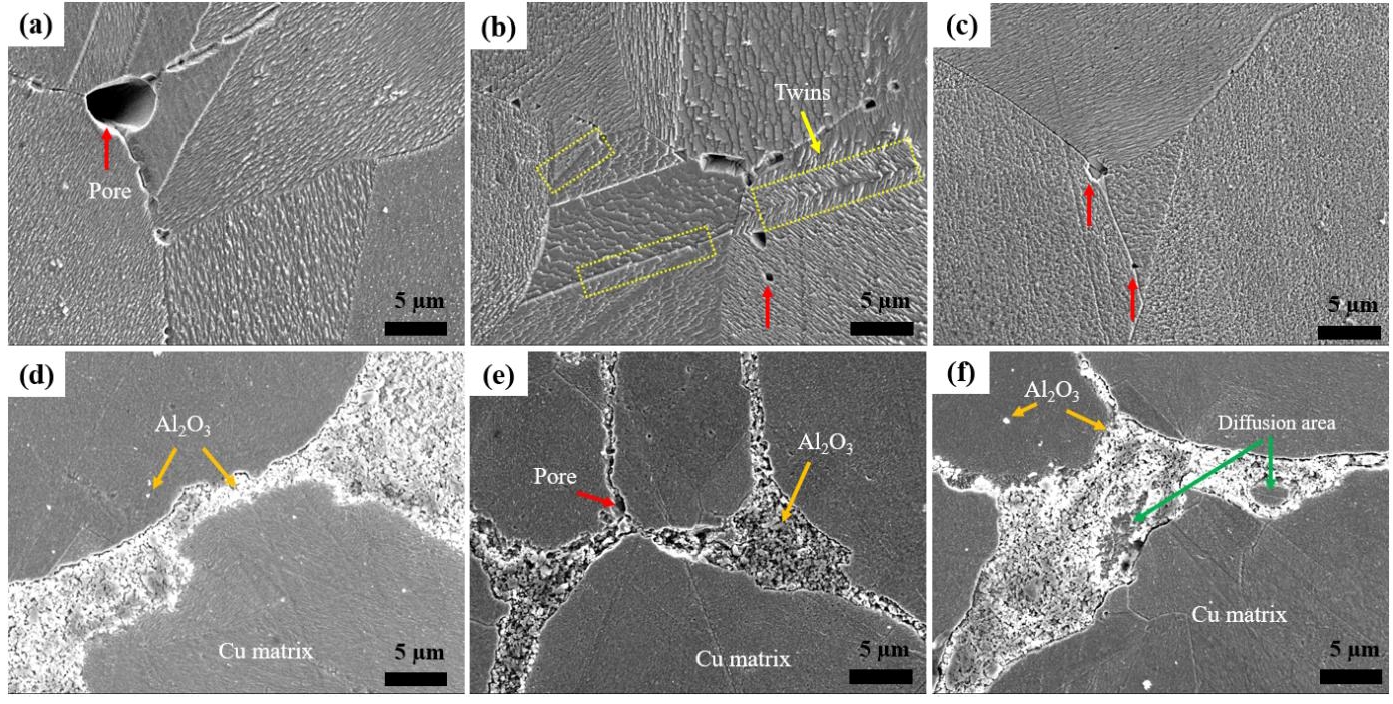

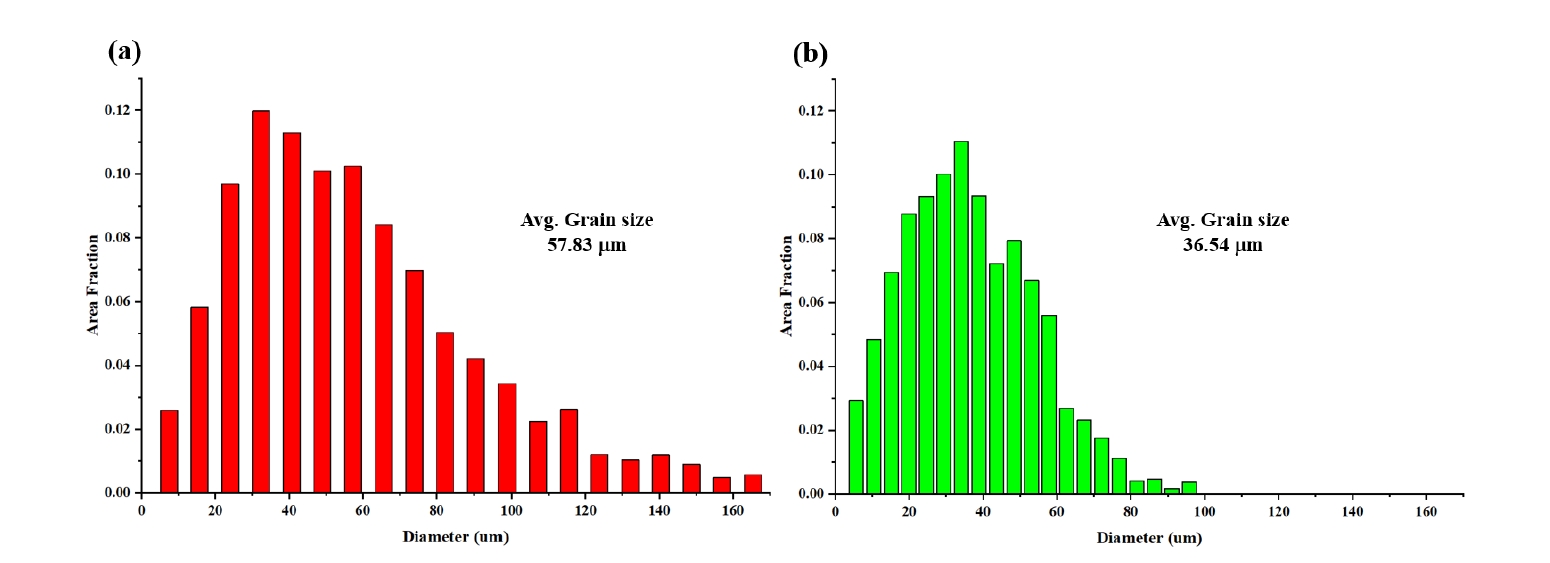


Fig. 1.
Fig. 2.
Fig. 3.
Fig. 4.
Fig. 5.
Fig. 6.
Fig. 7.
Fig. 8.
Fig. 9.
Fig. 10.
Graphical abstract
TOP
